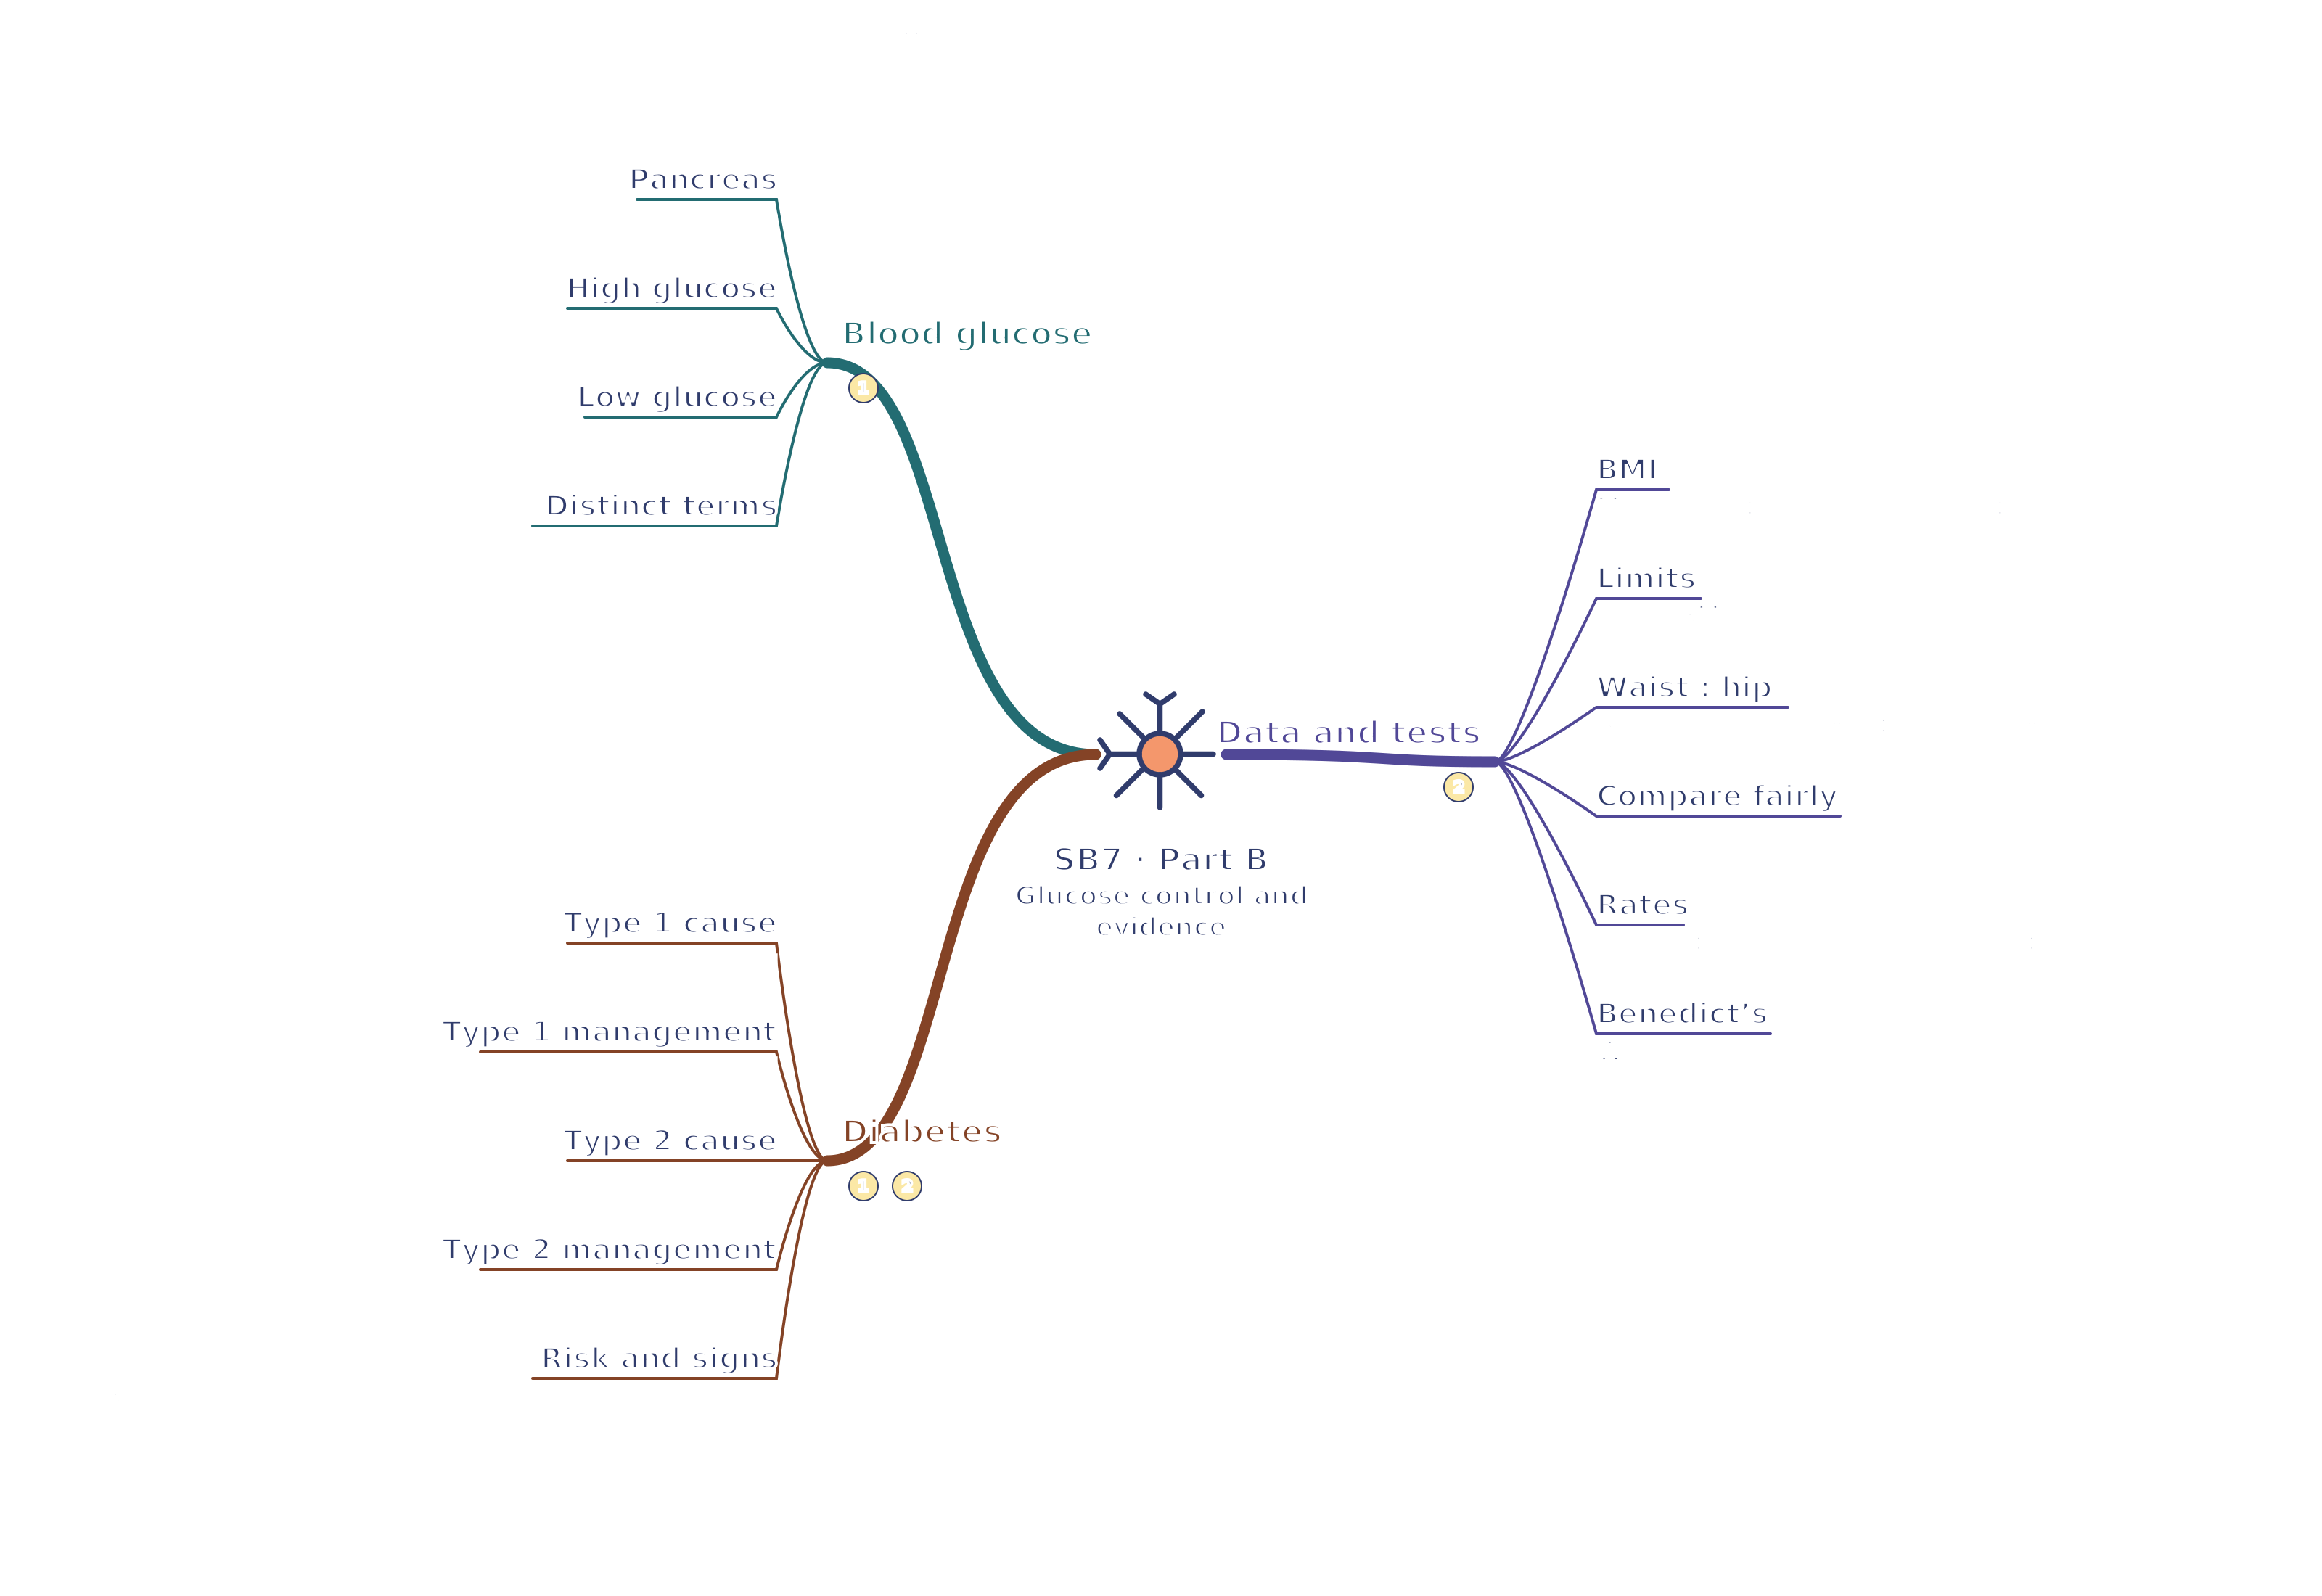
Back to revision notes Open full-size SVG Print mind map Part B · Glucose control and evidence Animal coordination, control and homeostasis mind map Use your browser’s Print command for A4 landscape, or choose A3 in its paper settings. The SVG remains sharp when enlarged. A text version follows the map.
Read the mind map as text Blood glucose Pancreas: Responds as glucose rises after food or falls with useHigh glucose: Insulin → cell uptake + glycogen formation → glucose fallsLow glucose: Glucagon → liver glycogen breakdown → glucose risesDistinct terms: Glucose: sugar; glycogen: store; glucagon: hormoneDiabetes Type 1 cause: Immune destruction of pancreatic insulin-producing cellsType 1 management: Insulin replacement; glucose monitoring, food and activityType 2 cause: Insulin resistance; insulin production may also be insufficientType 2 management: Activity / diet, medicines and sometimes insulinRisk and signs: Body fat, genes, age; urine glucose alone cannot diagnoseData and tests BMI: Mass (kg) ÷ height (m)²; 81 ÷ 1.80² = 25Limits: Adult BMI bands differ from child assessment; muscle ≠ fatWaist : hip: Same-unit ratio; 80 ÷ 100 = 0.80; abdominal fat linked to riskCompare fairly: Correlation ≠ certainty; control confounders; comparable groupsRates: Cases ÷ population × 100; 12 ÷ 200 × 100 = 6%Benedict’s: Warm simulated urine; blue → coloured = reducing sugar, not diagnosisConnections Blood glucose → Diabetes: Insufficient insulin action disrupts glucose control. Diabetes → Data and tests: Rates and risk indicators require careful interpretation.