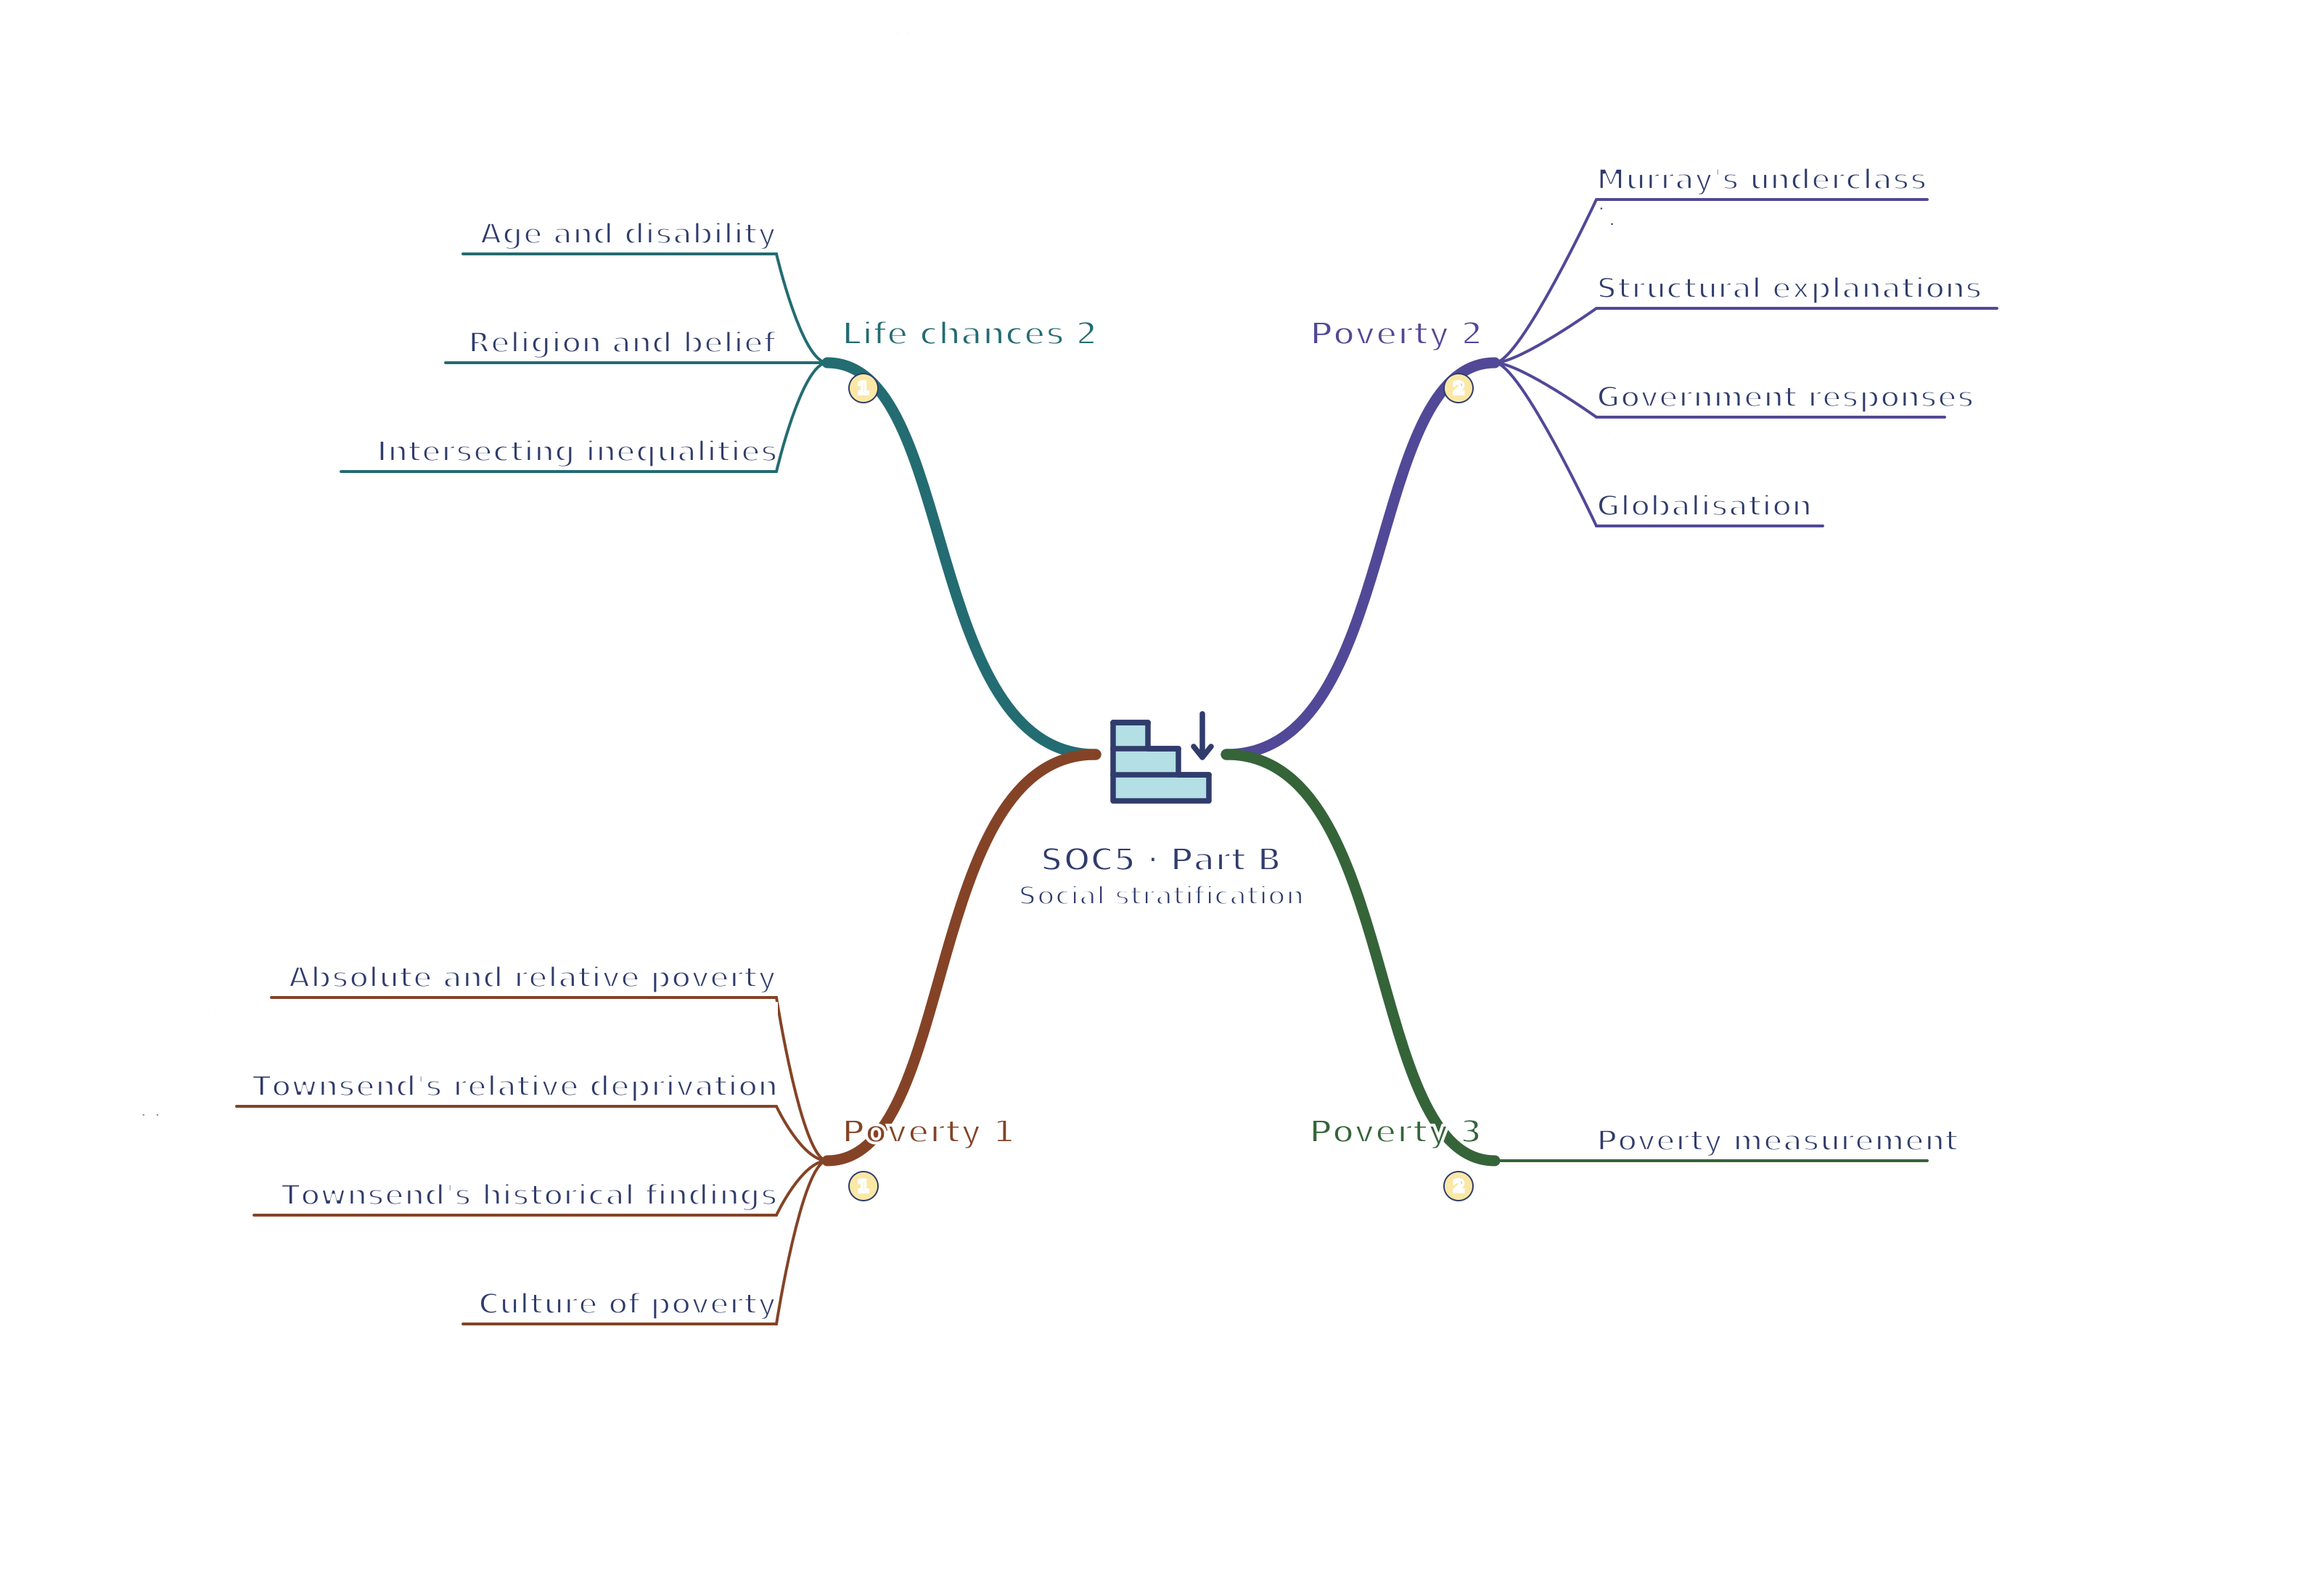
SOC5 · Life chances 2 / Poverty 1 / Poverty 2 / Poverty 3 Social stratification mind map
Use your browser’s Print command for A4 landscape, or choose A3 in its paper settings. The SVG remains sharp when enlarged. A text version follows the map.
Read the mind map as text
Life chances 2
Age and disability: Institutional design can create barriers or enable participation
Religion and belief: Belonging and discrimination can shape networks and participation
Intersecting inequalities: Categories combine in particular settings
Poverty 1
Absolute and relative poverty: Basic necessities differ from normal social participation
Townsend's relative deprivation: Measure resources against socially customary activities and conditions
Townsend's historical findings: Different definitions produced different estimates from the same society
Culture of poverty: Cultural explanations can confuse causes with responses to deprivation
Poverty 2
Murray's underclass: New Right claims emphasised incentives and dependence on welfare
Structural explanations: Employment, costs and discrimination can create poverty despite effort
Government responses: Benefits, services and employment policies affect resources and opportunities
Globalisation: Cross-border economic change can create work and insecurity
Poverty 3
Poverty measurement: Household income thresholds need context and comparable definitions
Connections
Life chances 2 → Poverty 1: Institutional barriers and resources shape the deprivation researchers try to measure.
Poverty 2 → Poverty 3: Historical poverty evidence and policy evaluation require different indicators and causal explanations.