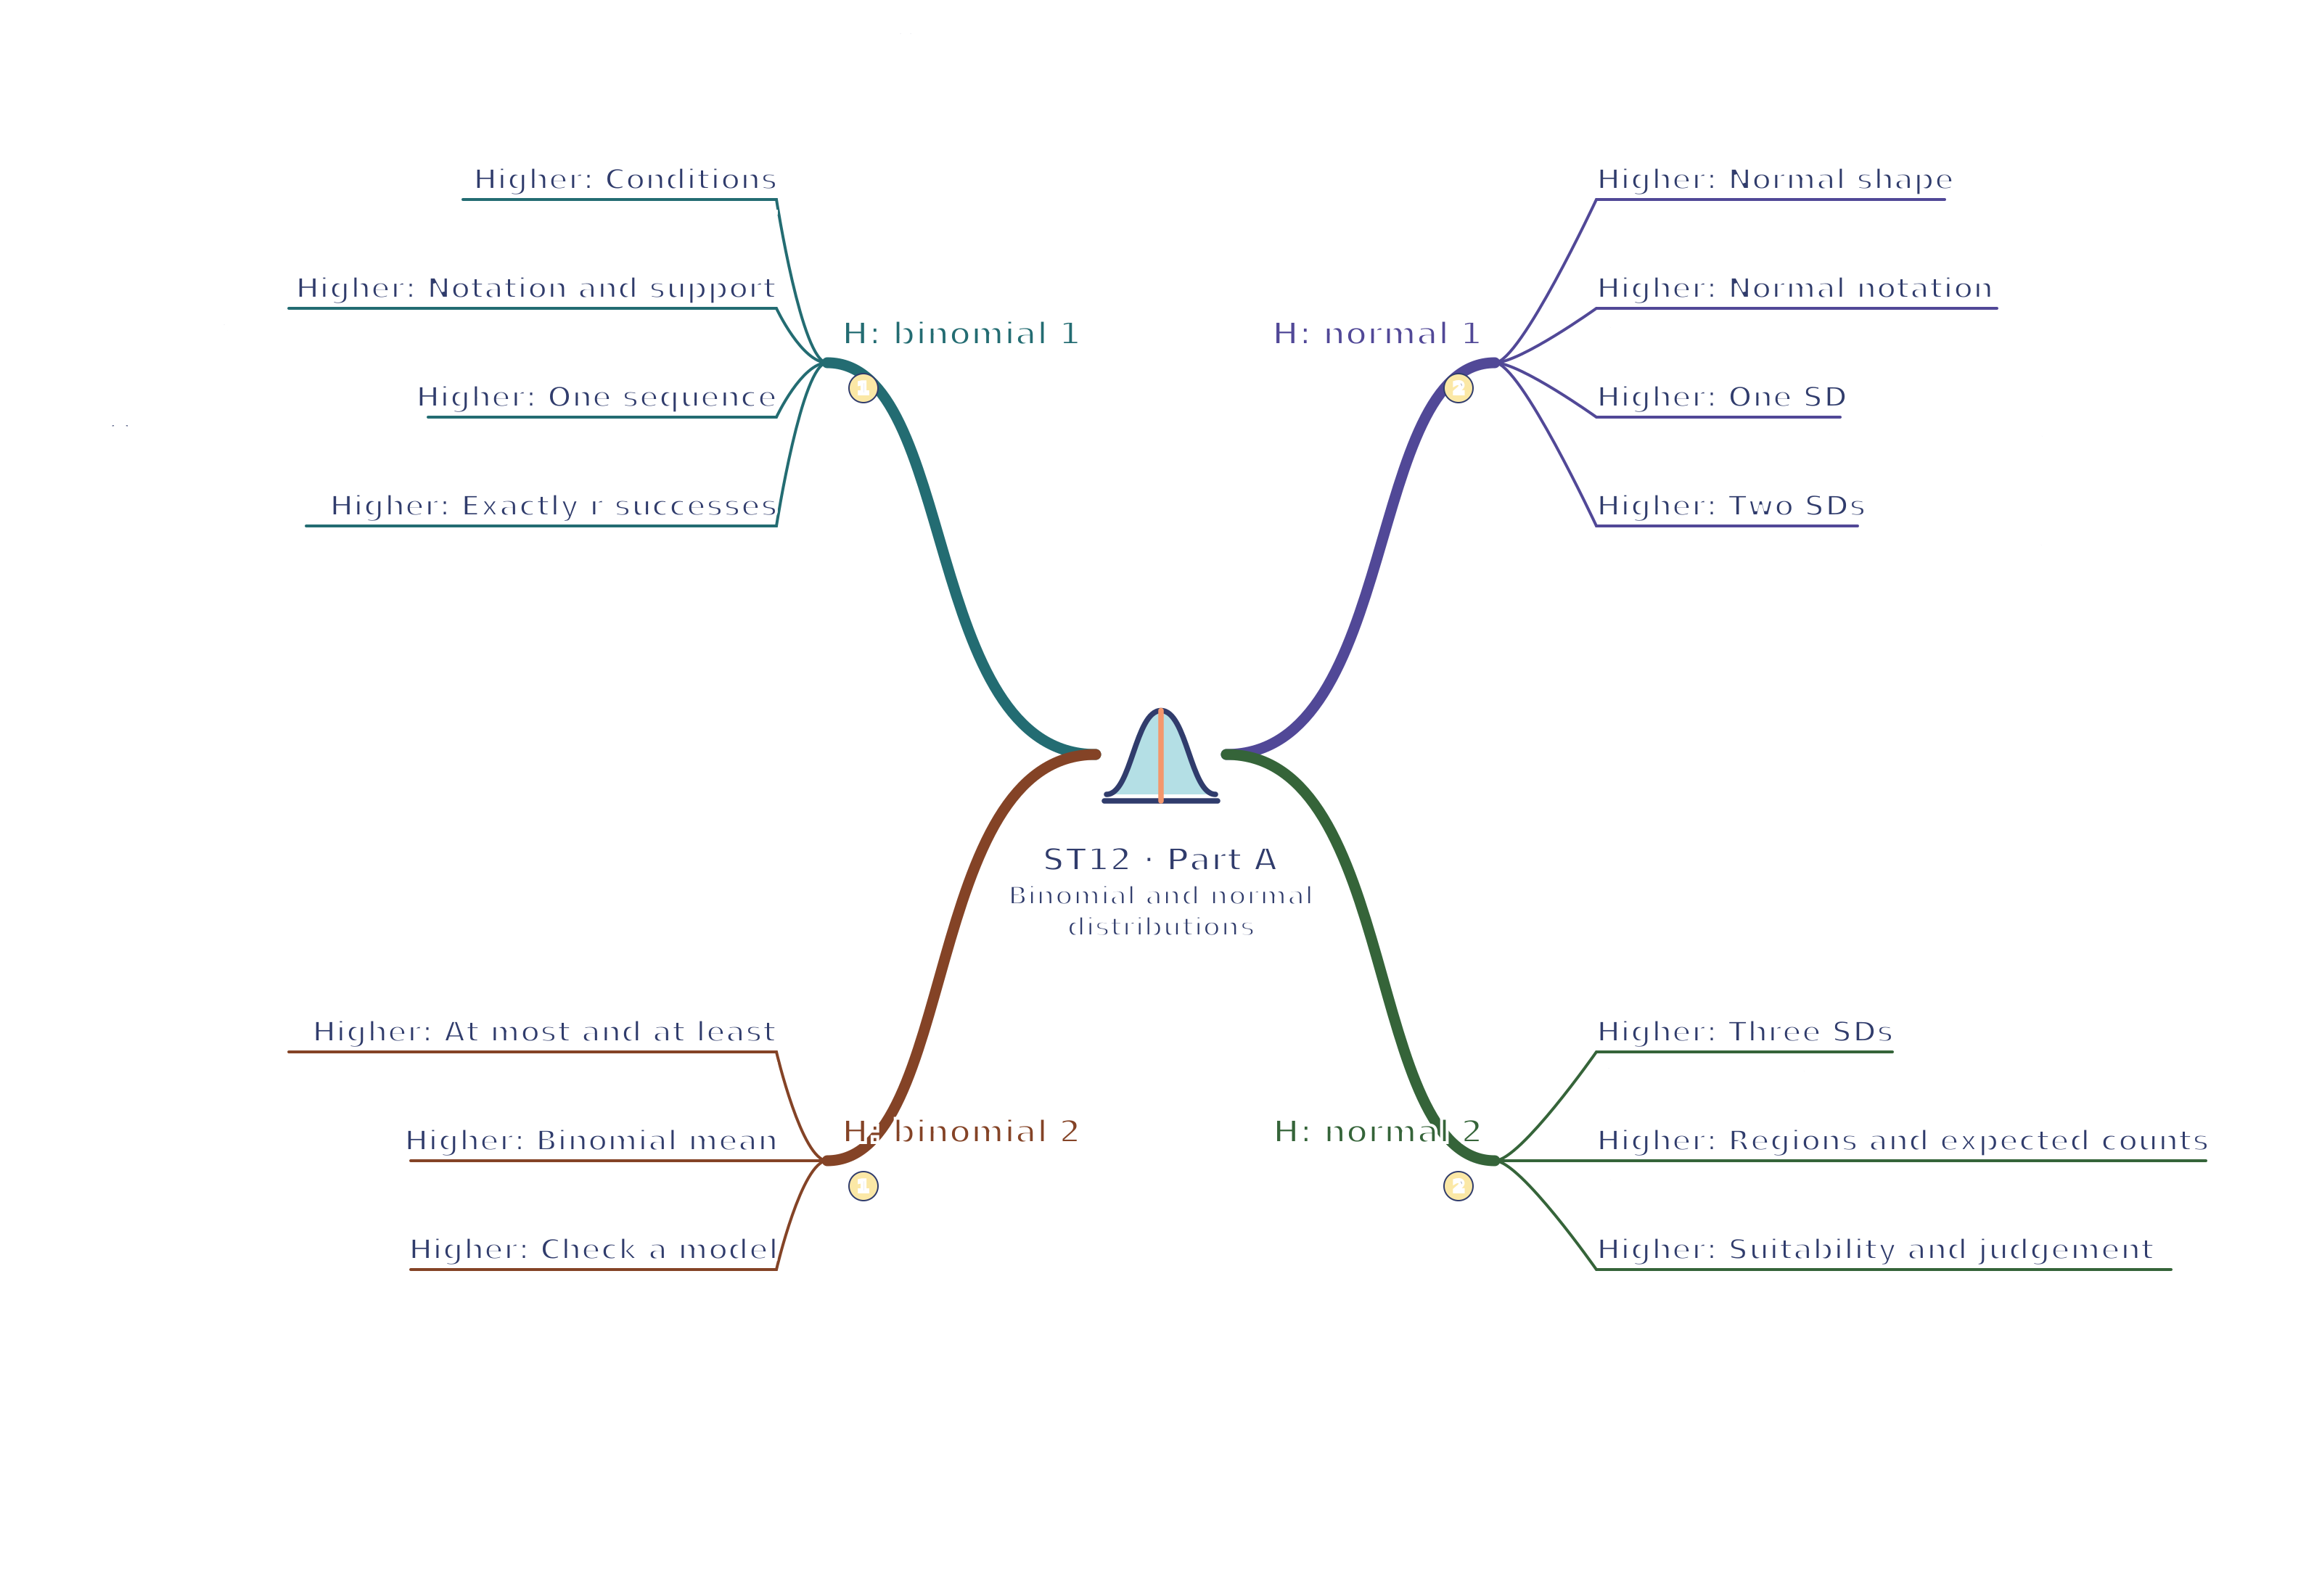
ST12 · H: binomial 1 / H: binomial 2 / H: normal 1 / H: normal 2 Binomial and normal distributions mind map
Use your browser’s Print command for A4 landscape, or choose A3 in its paper settings. The SVG remains sharp when enlarged. A text version follows the map.
Read the mind map as text
H: binomial 1
Higher: Conditions: Fixed n; independent two-outcome trials; constant p.
Higher: Notation and support: Binomial counts are integers from 0 to n.
Higher: One sequence: Multiply success and failure probabilities for one path.
Higher: Exactly r successes: Count arrangements then multiply path probability.
H: binomial 2
Higher: At most and at least: Inequality words determine included integer counts.
Higher: Binomial mean: np is average successes per group, not certainty.
Higher: Check a model: Compare observed with expected; consider model conditions.
H: normal 1
Higher: Normal shape: Continuous symmetric bell shape; centre measures coincide.
Higher: Normal notation: Second normal parameter is variance; take its square root.
Higher: One SD: Approximately 68% within one SD.
Higher: Two SDs: Approximately 95% within two SDs; tails 2.5% each.
H: normal 2
Higher: Three SDs: Beyond three SDs is very unusual, not impossible.
Higher: Regions and expected counts: Symmetry and subtraction locate model regions.
Higher: Suitability and judgement: Check variable, shape and context before modelling.
Connections
H: binomial 1 → H: binomial 2: Binomial conditions justify success-count probabilities used for expectations and model checks.
H: normal 1 → H: normal 2: The normal centre and SD define intervals whose approximate proportions support region estimates.