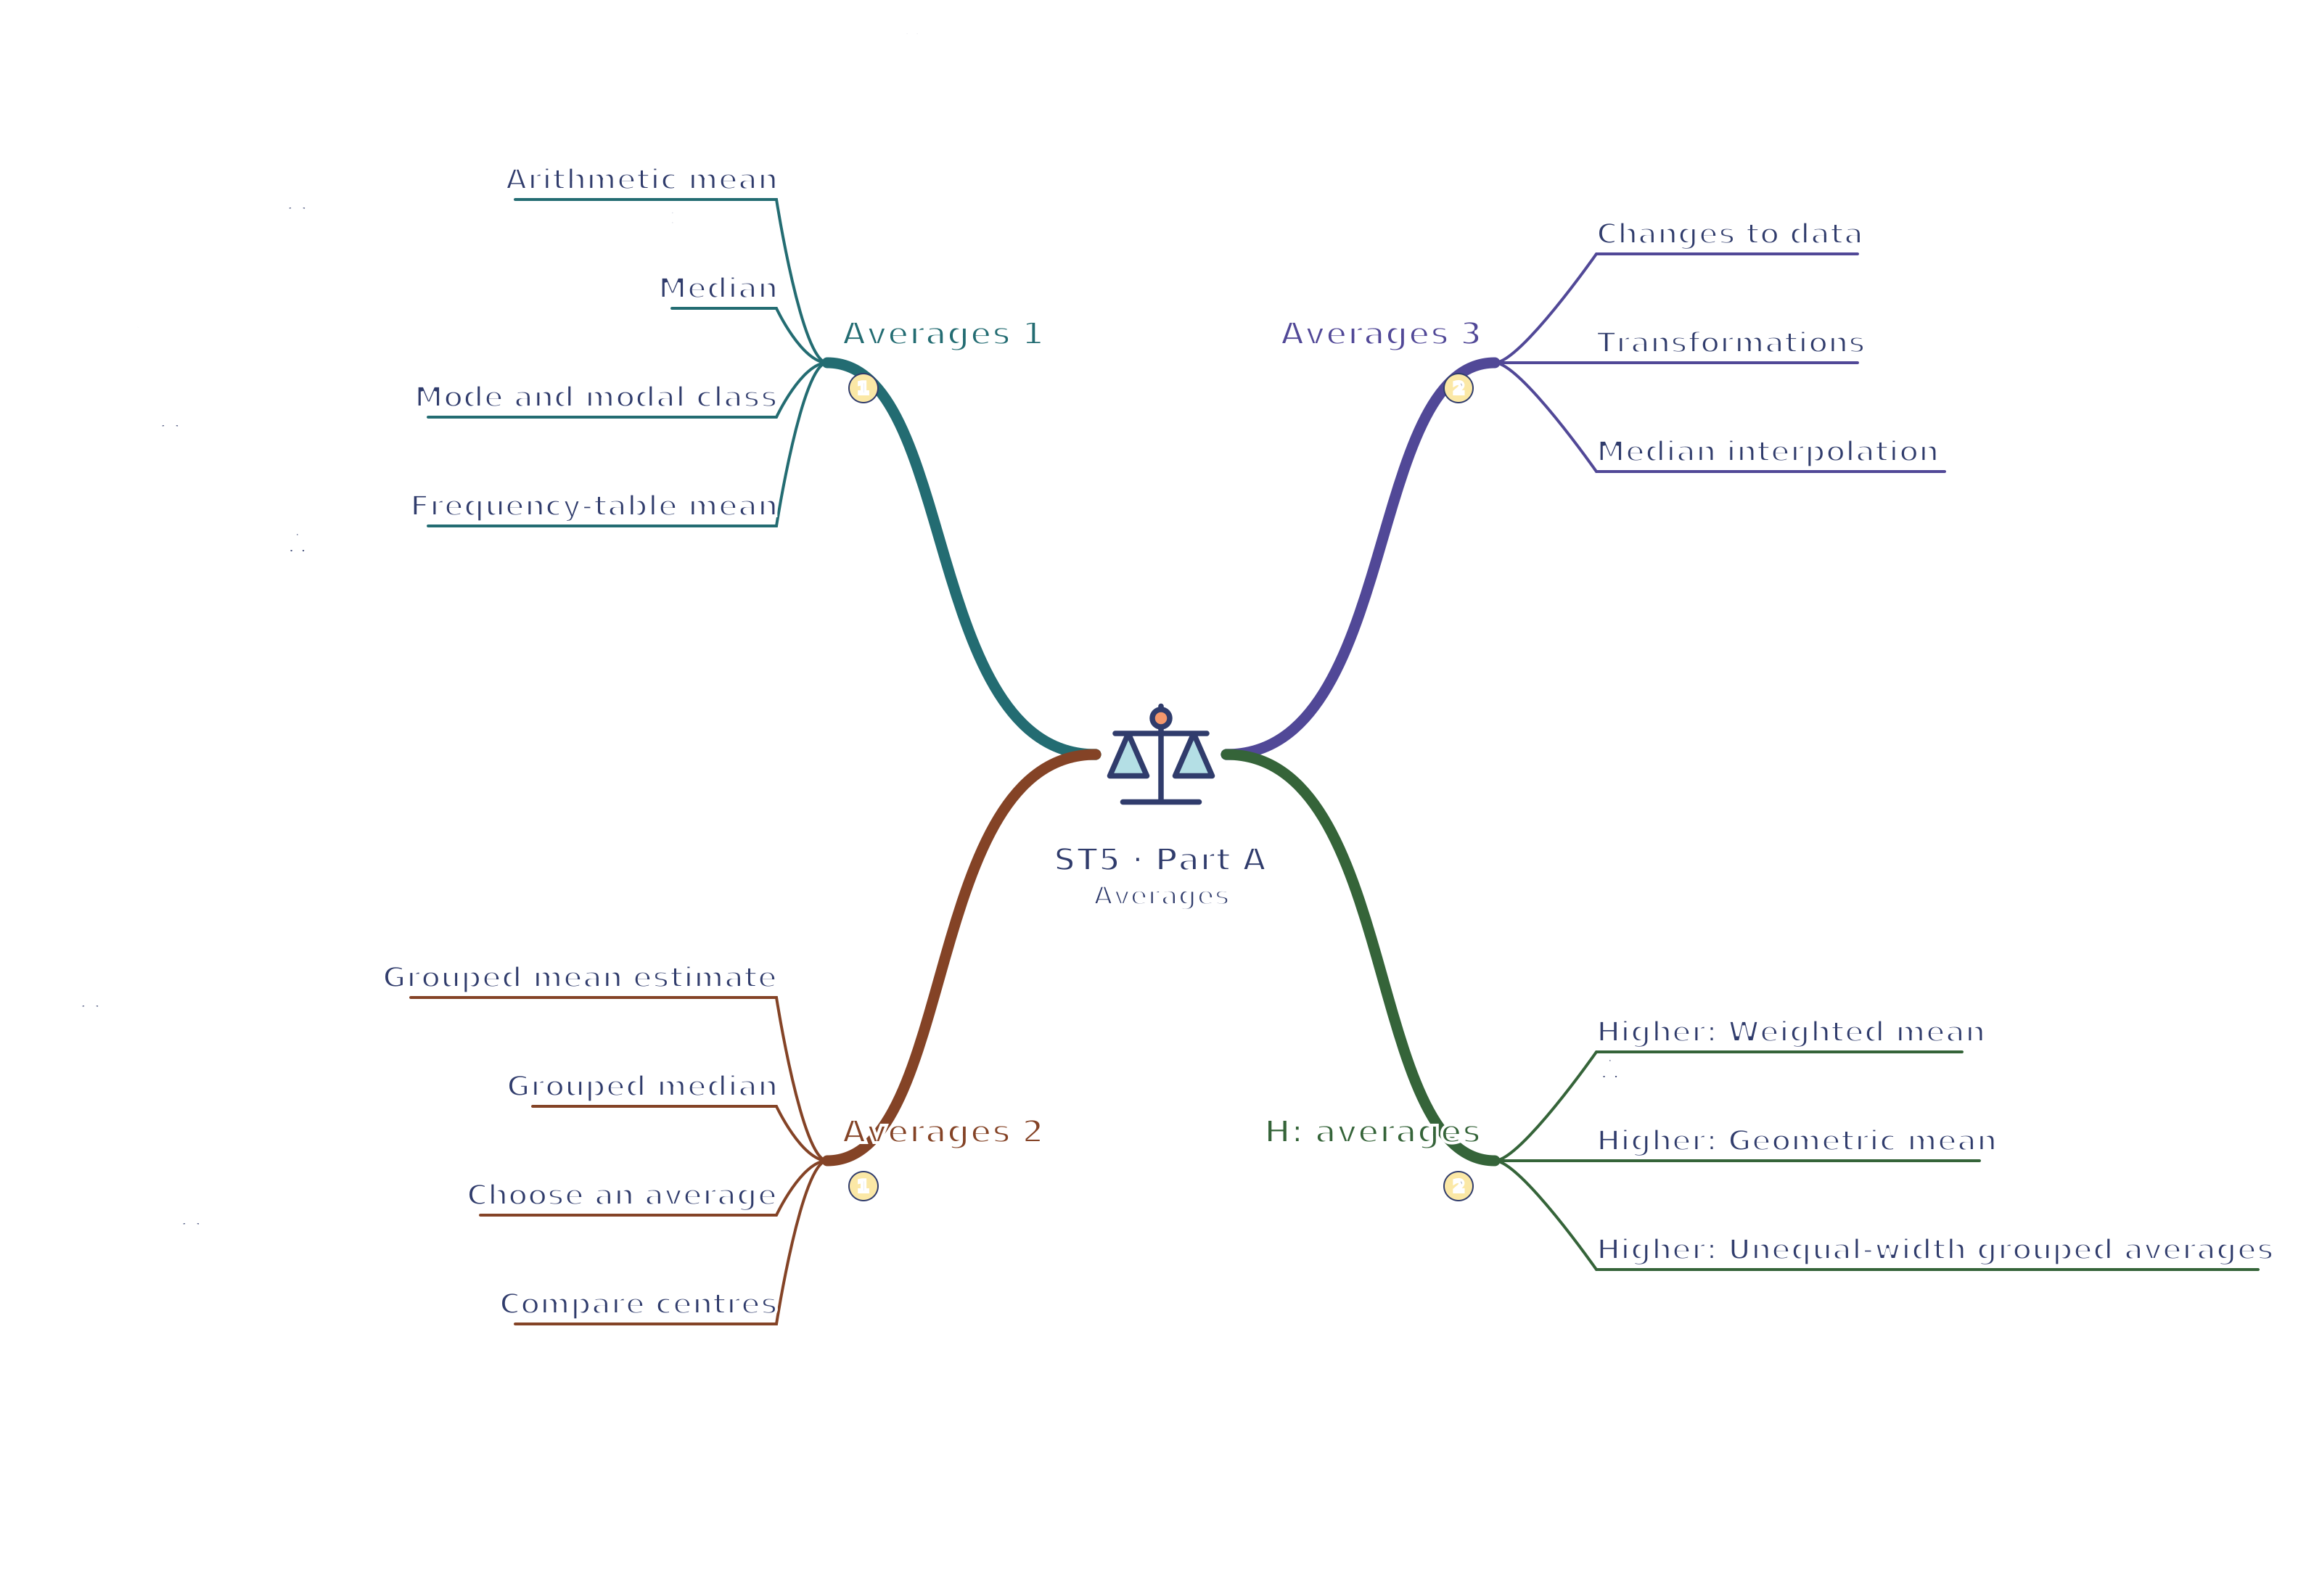
Use your browser’s Print command for A4 landscape, or choose A3 in its paper settings. The SVG remains sharp when enlarged. A text version follows the map.
Read the mind map as text
Averages 1
Arithmetic mean: Mean uses all values: total ÷ count.
Median: Sort first; average two middle values if needed.
Mode and modal class: Most frequent value; for equal-width classes, greatest frequency; ties possible.
Frequency-table mean: Weight each value by its frequency.
Averages 2
Grouped mean estimate: Midpoints approximate unknown values in classes.
Grouped median: Identify class; interpolate its cumulative position.
Choose an average: Match average to shape, type and purpose.
Compare centres: Compare matching summaries with units and context.
Averages 3
Changes to data: Update total and count; other averages need inspection.
Transformations: Apply consistent translations and positive scaling.
Median interpolation: Interpolate a cumulative position within its class.
H: averages
Higher: Weighted mean: Weighted total divided by total weight.
Higher: Geometric mean: Root of product for repeated multiplicative change.
Higher: Unequal-width grouped averages: Use each actual midpoint and median-class width.
Connections
Averages 1 → Averages 2: Frequency weighting and grouped estimates retain different amounts of exact information about the centre.
Averages 3 → H: averages: Grouped interpolation uses the median class width; Higher also permits unequal class widths.