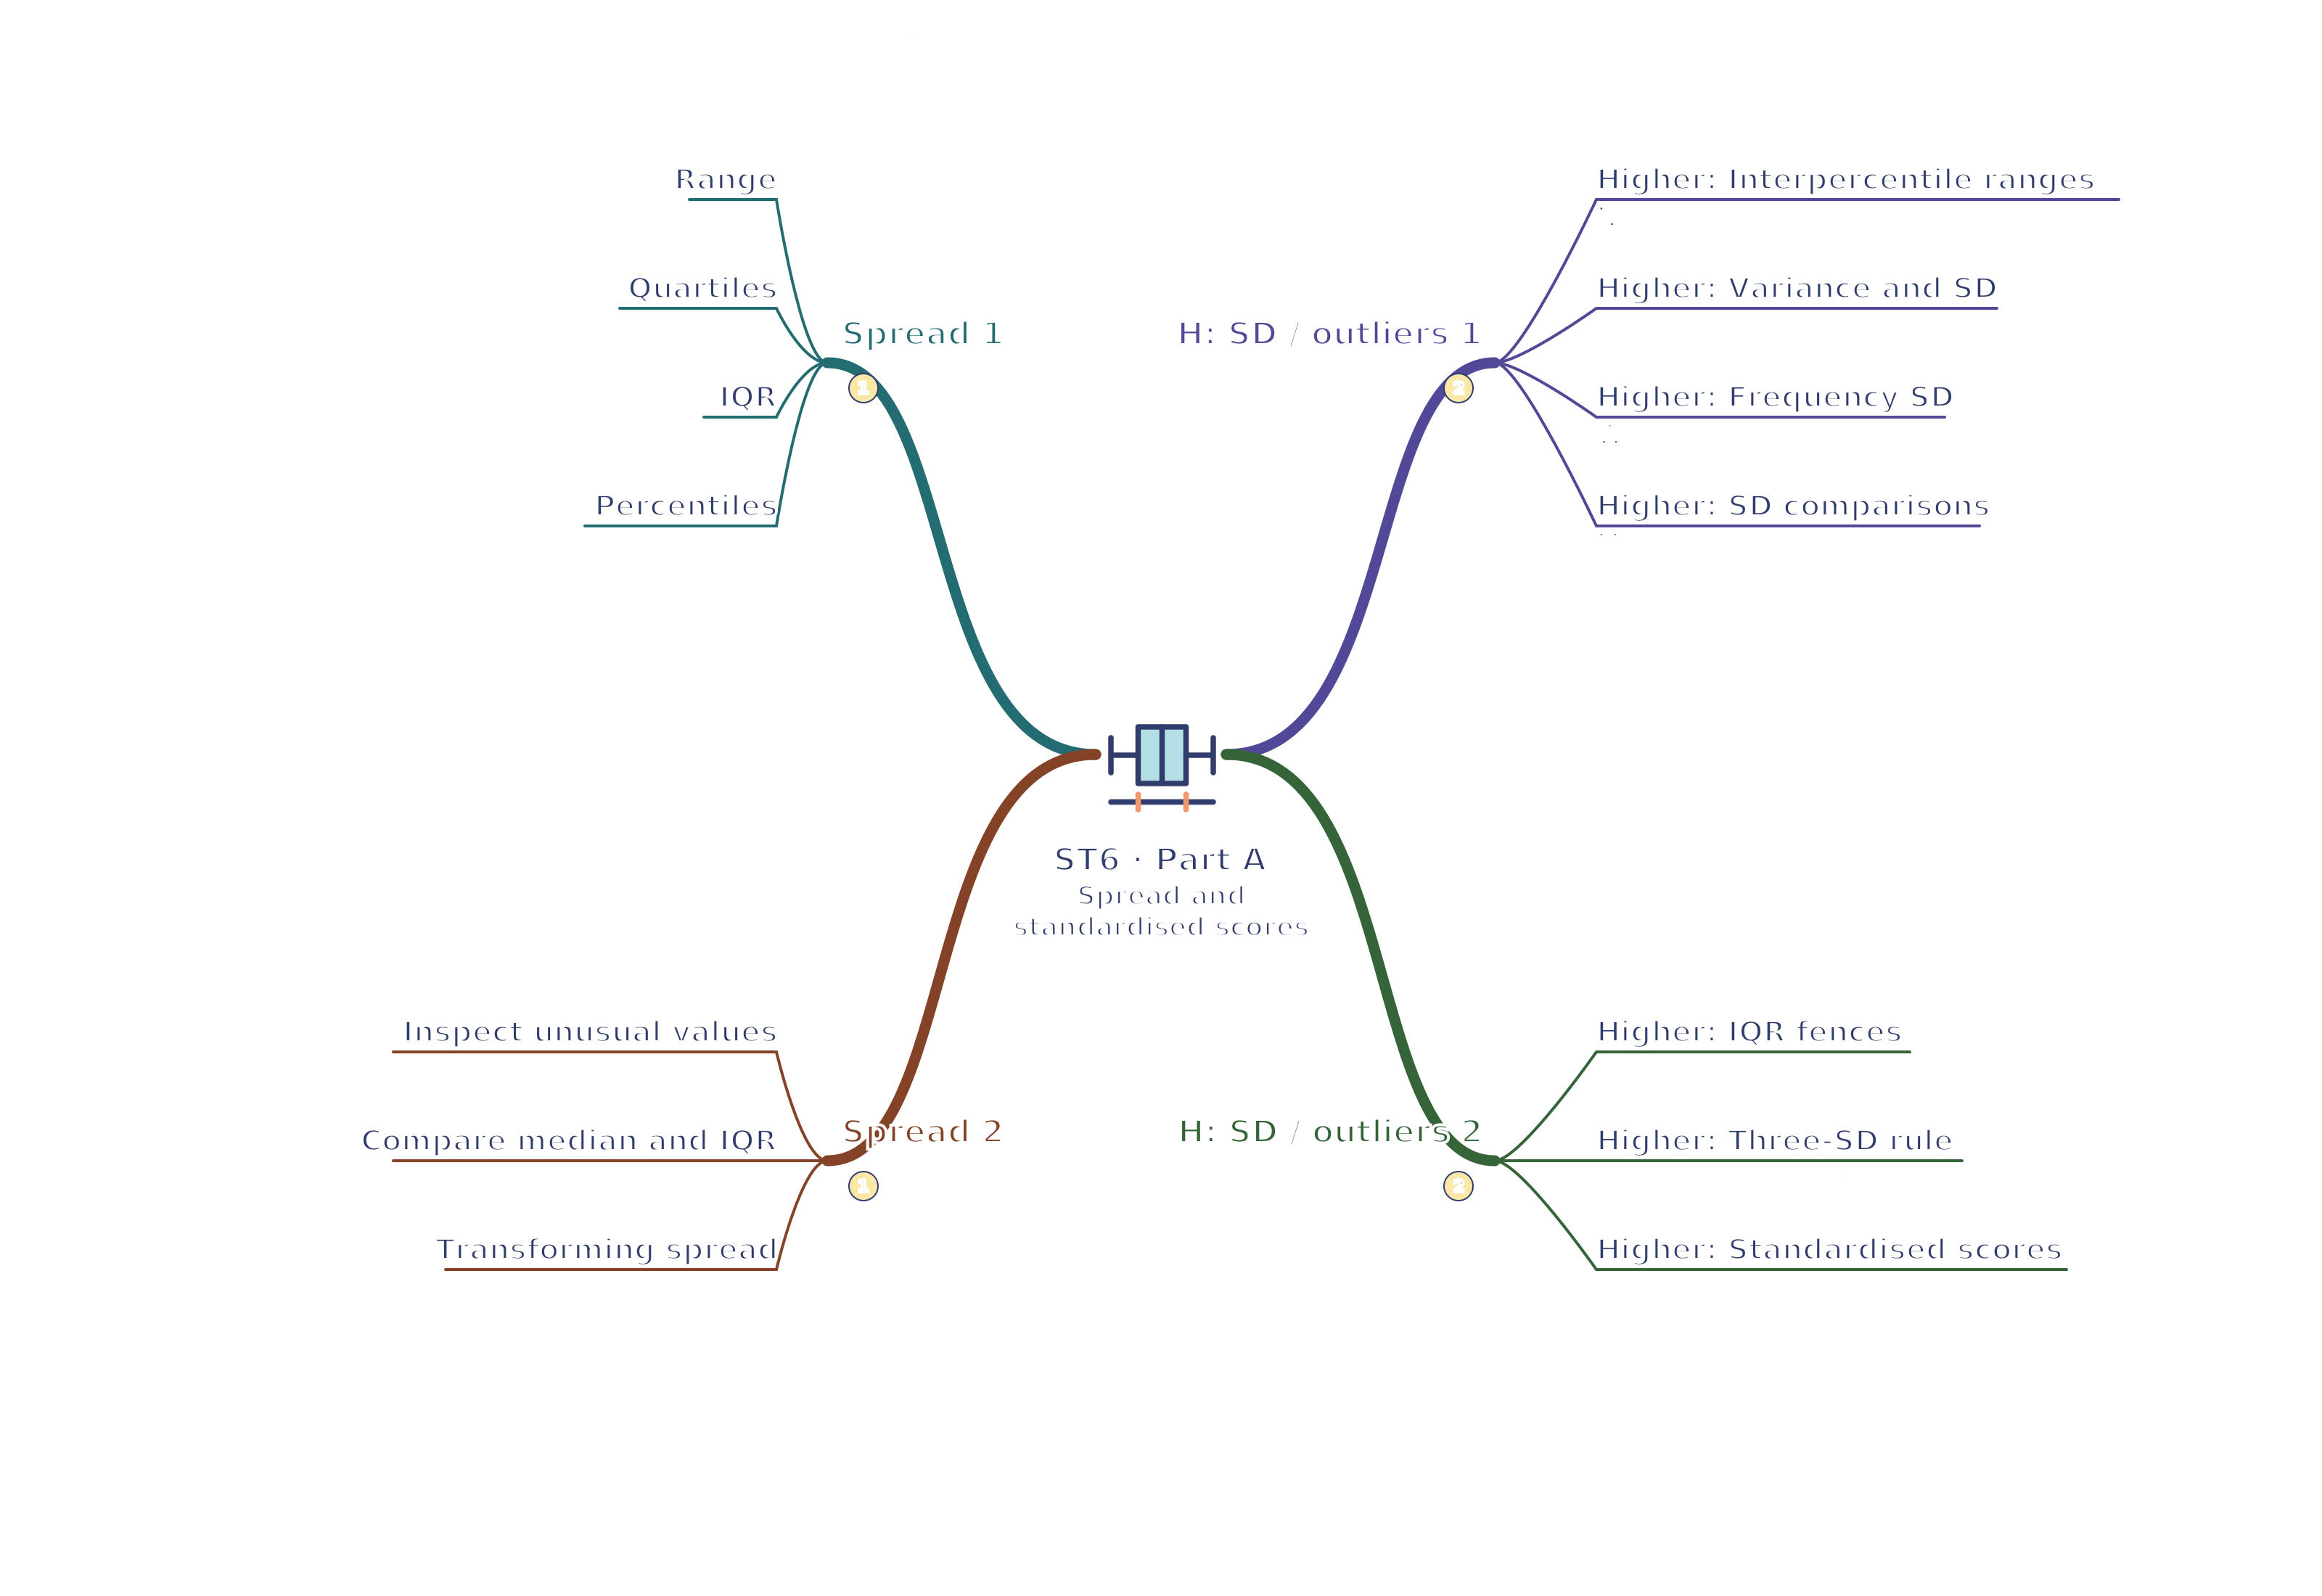
Use your browser’s Print command for A4 landscape, or choose A3 in its paper settings. The SVG remains sharp when enlarged. A text version follows the map.
Read the mind map as text
Spread 1
Range: Range = maximum − minimum; sensitive to extremes.
Quartiles: Ordered quarters; make the chosen convention clear.
IQR: IQR describes the middle half's spread.
Percentiles: Percentile is a boundary, not a frequency at one value.
Spread 2
Inspect unusual values: Verify unusual data before removing anything.
Compare median and IQR: Compare centre and consistency together.
Transforming spread: Translation preserves spread; scaling changes it.
H: SD / outliers 1
Higher: Interpercentile ranges: Name both percentile endpoints and enclosed share.
Higher: Variance and SD: SD = square root of mean squared deviation.
Higher: Frequency SD: Weight squared values; grouped SD is estimated.
Higher: SD comparisons: Mean with SD; SD scales linearly.