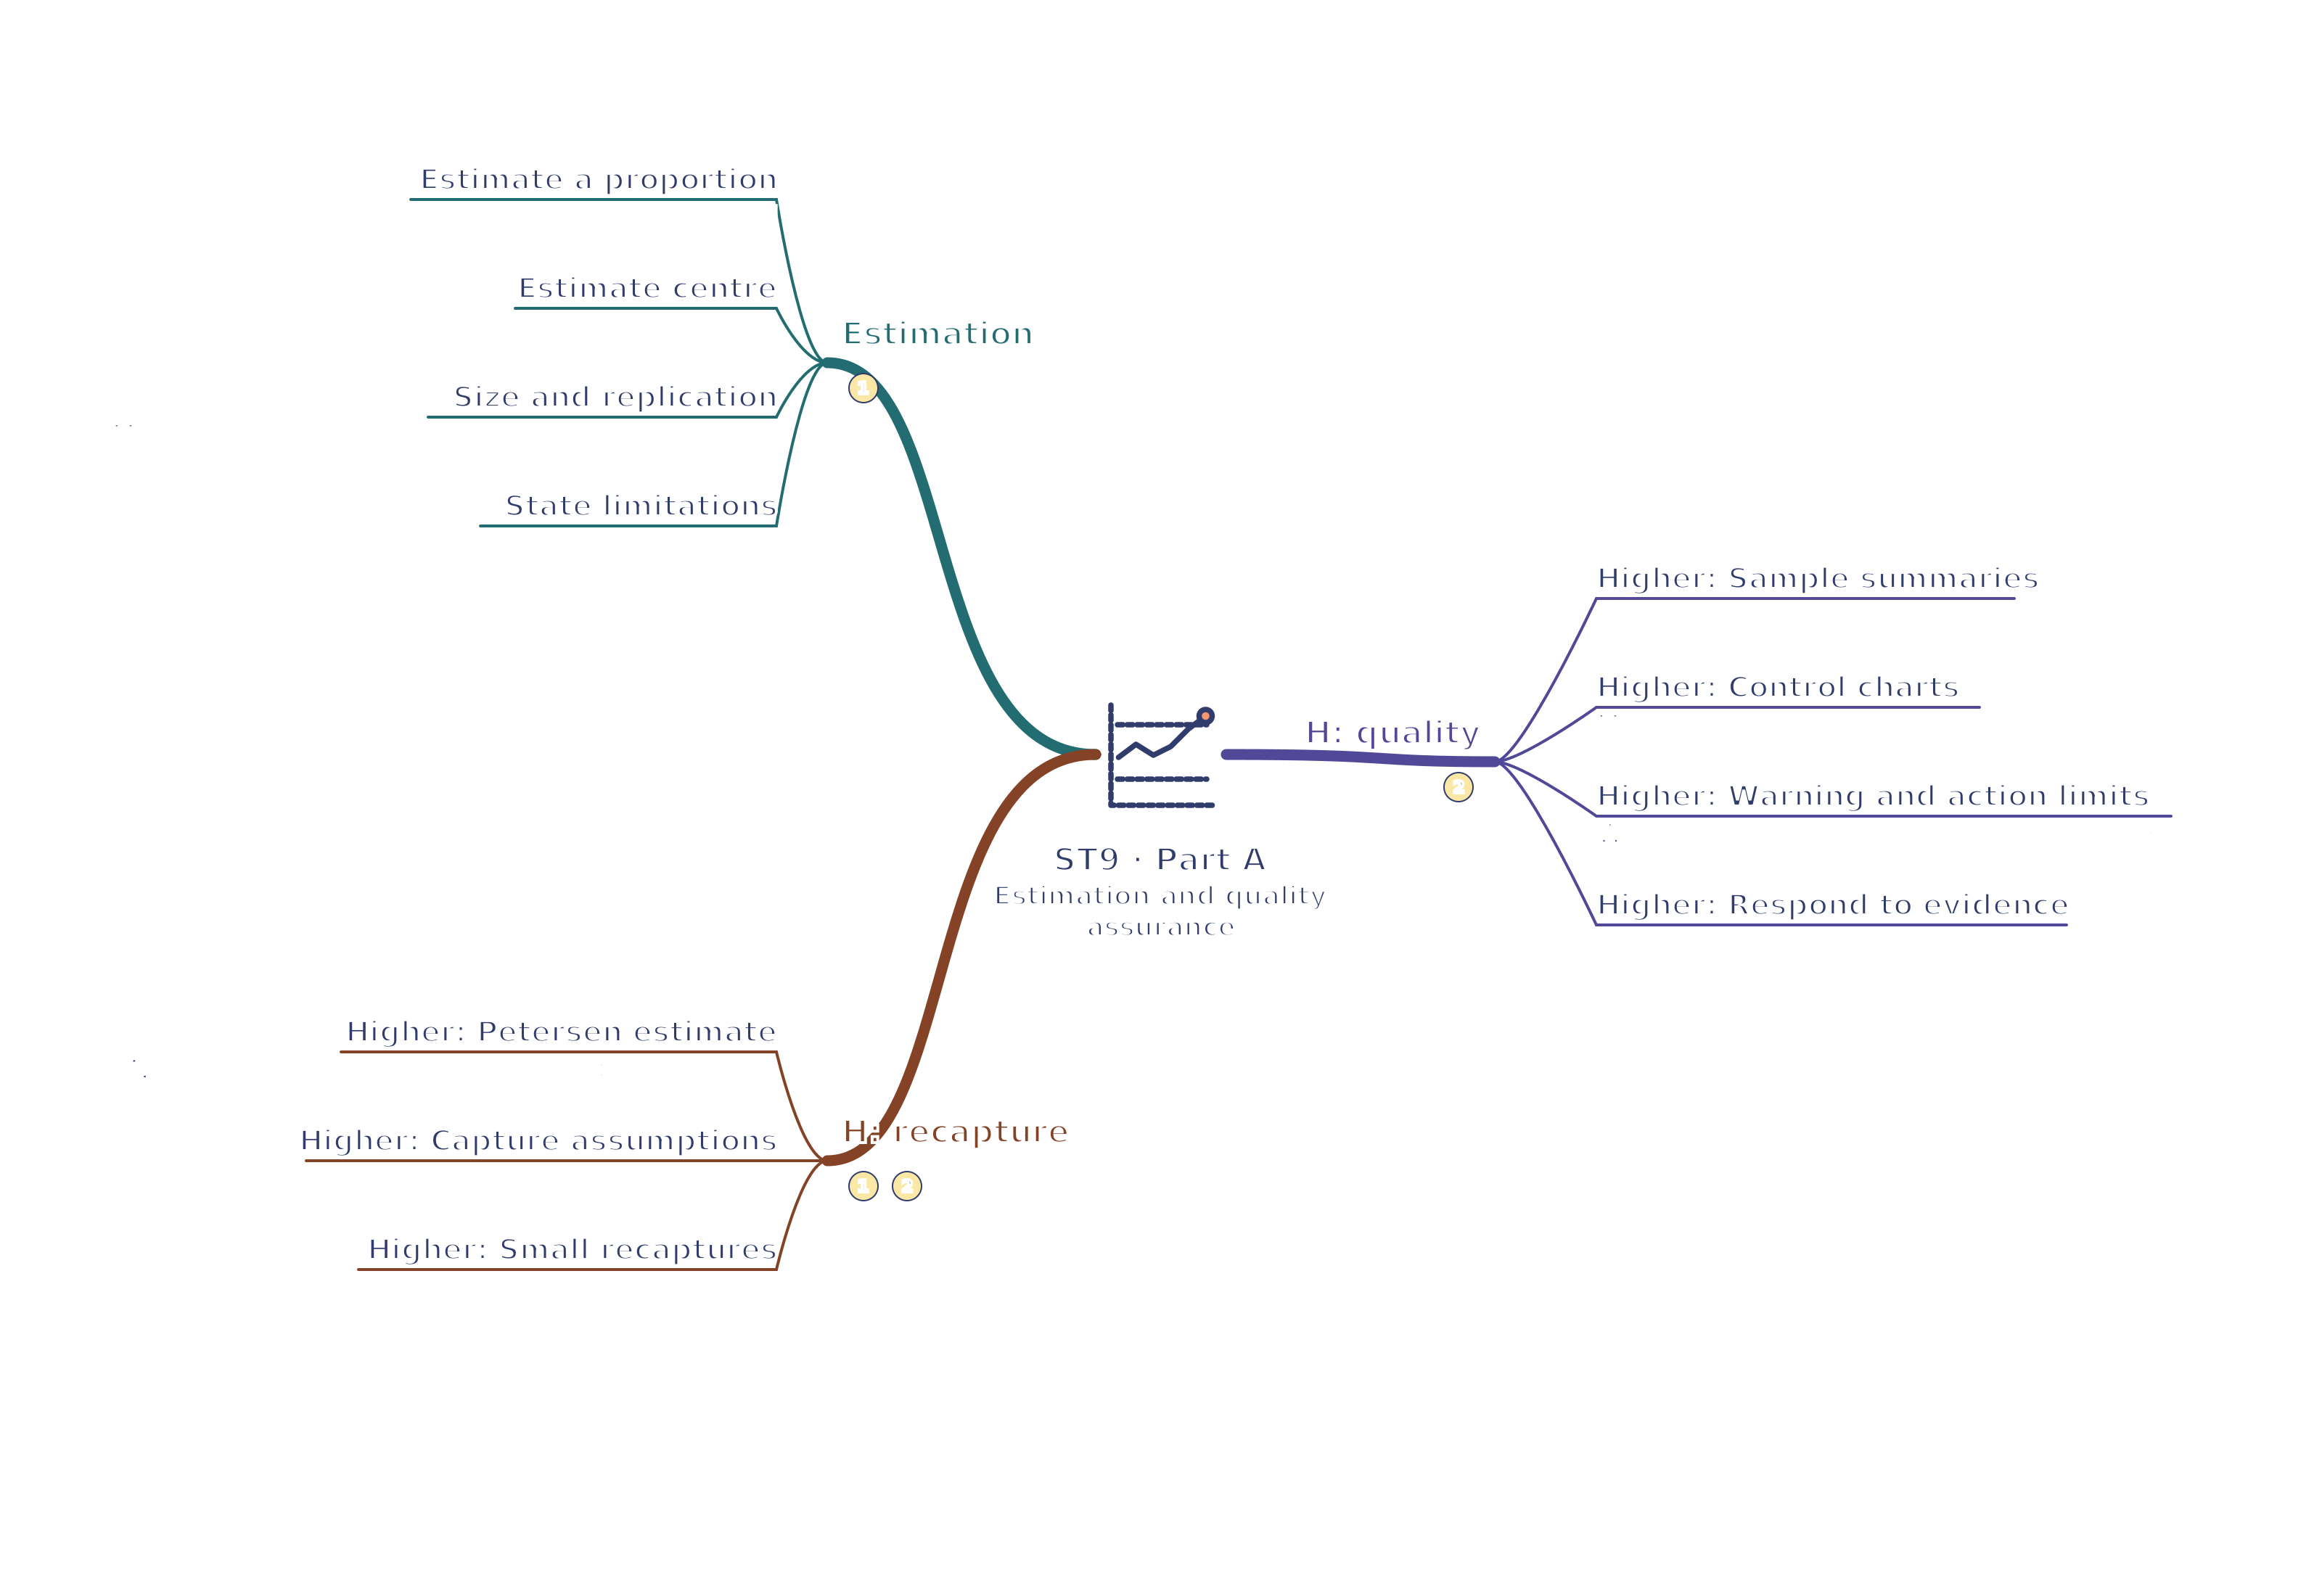
ST9 · Estimation / H: recapture / H: quality Estimation and quality assurance mind map
Use your browser’s Print command for A4 landscape, or choose A3 in its paper settings. The SVG remains sharp when enlarged. A text version follows the map.
Read the mind map as text
Estimation
Estimate a proportion: Sample proportion × population gives estimated count.
Estimate centre: Sample summaries estimate population characteristics.
Size and replication: More data reduces variation, not structural bias.
State limitations: Qualify estimates and improve the actual weakness.
H: recapture
Higher: Petersen estimate: N ≈ first marked × second catch ÷ recaptures.
Higher: Capture assumptions: Closure, retained marks, mixing and equal catchability.
Higher: Small recaptures: Small recapture denominators create uncertainty.
H: quality
Higher: Sample summaries: Sample means are less variable than individual values.
Higher: Control charts: Monitor a defined statistic with consistent sampling.