Distribution and density — Population distribution describes where people live; density compares population with area. A fictional 50,000 people in 100 km² gives 500 people per km², but the average can hide a dense town and sparsely settled surroundings. Compare maps at an appropriate scale and avoid assuming everyone is spread evenly across a country.
Factors influencing settlement — Water, relief, climate, soils, resources, transport, history, employment and public decisions can influence settlement. Physical advantages are not destiny: investment and technology can change opportunities and costs. Explain several interacting factors for a named place. A population map shows a pattern but does not by itself establish the reasons behind it.
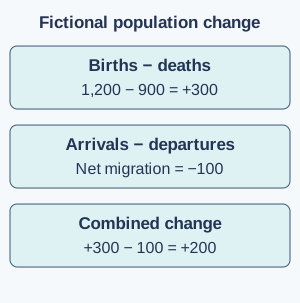
Births, deaths and natural change — Natural change is births minus deaths over a stated period. If a fictional population has 1,200 births and 900 deaths, natural increase is 300. Rates relate events to a population and period, often per 1,000 people per year, so they differ from raw totals. A larger country can have more births but a lower birth rate than a smaller one.
Migration and total change — Migration involves changing usual residence within a country or across borders. Net migration is arrivals minus departures, and total population change combines it with natural change under a stated definition. With natural increase 300 and net migration −100, the fictional population increases by 200. Internal migration changes local distribution without itself changing the national total.Fictional population calculation: births minus deaths gives natural increase of 300; arrivals minus departures gives net migration of −100; combining them gives an increase of 200. Full-size diagram
Population structures — A population pyramid shows age and sex structure using specified counts or percentages. Its shape reflects past births, deaths and migration, not one cause alone. A large older population can affect service and care needs, while many young people can affect education demand. Do not infer an individual's ability or value from their age group.
Migration experiences and connections
Reasons for movement — People move for combinations of employment, family, education, safety and environmental reasons. Push factors encourage people to leave a place, such as danger; pull factors attract people towards a place, such as a job opportunity. These are useful starting categories but do not capture every decision or constraint. A move can be voluntary, forced or a mixture of pressures. Use accurate respectful terms and avoid assuming one story describes all migrants.
Effects of migration — Migration can change labour supply, family networks, services and cultural connections in origin and destination places. Remittances are money sent to people elsewhere and can support households while creating dependencies or costs. Effects vary by skill, timing, policy and local conditions. Compare evidence about particular places rather than presenting migration as automatically beneficial or harmful everywhere.
Evaluating population evidence — Censuses, surveys and administrative records use different definitions, coverage and dates. Compare like periods and areas and note uncertainty, especially where boundaries or methods change. A dramatic raw total without a denominator, the total population it is being compared with, can mislead. For example, 100 people means something different out of 200 residents than out of 20,000. A map of averages should be combined with other information before making a claim about living conditions.
Urban growth and change
Urbanisation and urban growth — Urbanisation is an increase in the proportion of a population living in urban areas; urban growth is an increase in the number of urban residents. A city can grow while the national urban proportion remains similar. Migration, natural change and reclassification can contribute. Definitions of urban differ, so cross-country comparisons need care.
City functions and connections — Cities combine housing, employment, education, healthcare, transport and cultural functions, with different patterns across neighbourhoods. They depend on food, water, energy and labour connections beyond their boundaries. A port city such as Mumbai or Lagos has overseas links as well as local ones. Not every resident works in the city's most famous industry.
Opportunities and inequalities — Urban concentration can support jobs, services and exchange while producing unequal access to housing, transport and safe environments. Living conditions vary within a city. Informal settlements are neighbourhoods where housing may have been built without formal planning permission or secure rights to the land. They can contain strong communities and enterprises alongside service insecurity; avoid reducing residents to a problem or assuming every neighbourhood has identical circumstances.
Urban environmental pressures — Buildings, roads, waste, water demand and altered surfaces can affect runoff, heat, air and ecosystems. An urban heat island is an urban area that is warmer than nearby less-built-up surroundings. Buildings and paving can store heat, less vegetation can mean less cooling through evaporation, and energy use can add heat. These effects arise from interacting surface, vegetation and energy-use patterns, not simply from population numbers alone. Compare local measurements carefully and consider who is most exposed to heat or flooding and who can access protective services.
Planning and evaluating urban futures
Managing urban change — Transport improvements, safe affordable housing, green space, waste services and water infrastructure can address different needs. Plans need maintenance, resources and community participation as well as construction. Improving one area can raise costs or displace some residents. Evaluate who benefits, who pays and what unintended effects could occur.
Sustainable urban choices — A more sustainable city seeks long-term social, economic and environmental well-being within resource limits. Walking routes, accessible public transport and suitable green infrastructure can help, but the best mix depends on place and users. A single cycle lane or planted roof does not prove that an entire city is sustainable; assess connected systems and actual use.
Comparing neighbourhoods — Use mapped services, field observations, suitable statistics and residents' perspectives to compare areas. Choose consistent indicators and ethical methods and explain scale and sample limits. A short visit is a partial view, not a verdict on a community. Separate the evidence of a difference from your proposed explanation and test alternatives where possible.
Test yourself
50 questions · Random sets of 10. These quick checks support revision; practise longer explanations and justified judgements too.
Mind map
Use the branches to recall the ideas and explain their connections. Check the revision notes for the full detail.
KS3GEO5 · 1
View KS3GEO5 · 1 mind mapOpen the full-size map to zoom. Use the printable view for A4 landscape or enlarge to A3.
 Mr Kidman's Classroom