Weather and climate — Weather describes atmospheric conditions over short periods; climate describes longer-term patterns and variability, commonly summarised over several decades. A cold day does not disprove a warming climate, and one hot day does not establish a long-term trend. Use comparable observations and a suitable timescale to answer the question being asked.
Measuring weather — Temperature, rainfall, wind speed and direction, pressure and cloud cover describe different conditions. For example, measure air temperature with a thermometer in °C and rainfall with a rain gauge in mm. Use an anemometer for wind speed and a wind vane for direction. Record where instruments are placed and use consistent observation times. A thermometer in direct sun beside a hot wall may not represent local air temperature fairly. Record the method so differences between sites are not confused with differences caused by equipment or timing.
Air pressure and movement — Air pressure reflects the weight of air above an area; differences help drive wind. Rising air often cools and can form cloud if moisture condenses, while sinking air often warms and can discourage cloud. These are useful patterns rather than guarantees of identical daily weather everywhere. Read pressure patterns alongside other forecast information.
Cloud and rainfall — Water vapour can condense into tiny droplets or ice crystals when air cools to suitable conditions. Rainfall can develop when moist air rises over hills or mountains, rises after ground heating, or is lifted where air masses meet at a weather front. As air rises it cools; water vapour can condense, and droplets or ice crystals can grow large enough to fall. A mountain’s windward side faces the incoming wind; its leeward side is sheltered. Rising air can bring wetter windward conditions and drier leeward conditions, depending on the air mass and circulation.
UK weather and microclimates — The UK is surrounded by sea: this is its maritime location. Air masses are large bodies of air with similar temperature and moisture, and different ones reach the UK. These, together with the height and shape of land, contribute to variable weather. A school site can also contain microclimates influenced by shelter, surface material, shade and vegetation. Compare a sheltered planted area with an exposed paved area using a fair method. Do not claim every local difference is caused by one factor without testing alternatives.
Climate patterns and ecosystems
Climate controls — Latitude, altitude, distance from the sea, ocean circulation and prevailing winds influence climate. Higher ground is often cooler, while seas can moderate seasonal temperature changes near coasts. Local relief and rainfall patterns create variation within a broad climate zone. Explain a named place using several interacting influences rather than only its distance from the Equator.
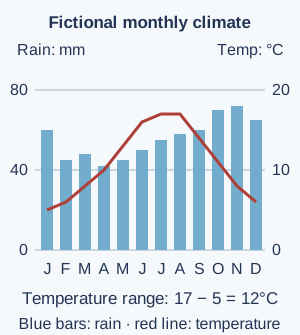
Reading climate graphs — A climate graph commonly displays monthly precipitation and temperature with different scales. State the units, identify seasonal patterns and calculate values carefully: annual rainfall adds monthly totals, while annual temperature range is the highest monthly mean minus the lowest. A fictional place with monthly means from 5°C to 17°C has a 12°C range; that is not its annual mean temperature.Fictional monthly data show blue rainfall bars using the left scale and a red temperature line using the right scale. The temperature range is 12°C. This is a worked example, not observations from a named place. Full-size diagram
Monsoon climates — A monsoon involves a seasonal change in prevailing winds and associated rainfall patterns. In parts of South Asia, a wetter summer season is important for farming and water supply, while variability can bring drought or flooding. Timing and totals vary across the region. Do not define monsoon simply as one storm or assume all India receives identical rain.
Biomes and ecosystems — A biome is a broad environmental region associated with climate and characteristic vegetation; an ecosystem includes interactions among organisms and their physical environment. Rainforest, savanna, desert, temperate forest and tundra illustrate broad contrasts. Boundaries are not perfectly sharp and people modify landscapes. A simplified biome map helps comparison but does not describe every species or land use within each area.
Natural systems and human needs — Vegetation, soils, water and climate interact to support food production, habitat and regulation of flows. Removing vegetation can reduce interception, when leaves and branches catch rainfall before it reaches the ground. This can affect erosion and local conditions, while farming and cities depend on water and functioning ecosystems. Explain both directions of interaction rather than describing nature as a passive background that people use without changing it.
From glacial climates to the present
Ice Age and interglacial change — The Quaternary is the most recent period of Earth’s history, beginning about 2.6 million years ago. During this period, colder glacial periods alternated with warmer interglacial periods. The last glacial period left ice-shaped landscapes in parts of the UK, while the present Holocene interglacial began around 11,700 years ago. 'Ice Age' is used in different ways, so clarify the timescale rather than assuming Earth was uniformly frozen or that all ice disappeared at once.
Evidence of past climate — Ice cores, pollen, sediments, tree rings and historical records provide different kinds of climate evidence across different periods. An ice core can preserve information about past atmosphere, while pollen can suggest earlier vegetation. Scientists combine sources and assess uncertainty. One local record may reflect regional conditions and cannot automatically establish a global pattern by itself.
Natural influences on climate — Changes in Earth's orbit affect the distribution of incoming solar energy over long periods; volcanic activity and solar variation can also influence climate. These natural factors help explain past changes, but their existence does not establish that they explain the present warming trend. Compare the timing, direction and scale of proposed causes with observations.
The greenhouse effect — Sunlight warms Earth’s surface. The warm surface gives out infrared radiation, which carries energy. Greenhouse gases, including carbon dioxide and water vapour, absorb and re-emit some of this radiation in different directions, including towards the surface. This helps keep Earth’s surface warmer than it would otherwise be. Increasing their concentration changes the energy balance. The natural greenhouse effect is not the same process as ozone depletion and does not mean sunlight cannot enter. Distinguish the mechanism from an analogy such as a blanket, which has limits.
Human-driven climate change — Burning fossil fuels, land-use change and other activities increase greenhouse-gas concentrations and are the principal cause of recent global warming. Observations and physical understanding support this conclusion; natural variability still affects individual years and places. Avoid claiming that every weather event has one simple cause or that a cool season reverses a long-term global trend.
Effects and responses
Changing risks and uneven effects — Warming can affect heat extremes, ice, sea level, water and ecosystems, but effects vary by location and vulnerability. Coastal flooding depends on sea level, storms, land elevation and exposure, while drought risk also involves demand and management. Use dated place-based evidence and distinguish a projected risk from an already measured change.
Mitigation and adaptation — Mitigation reduces causes, such as greenhouse-gas emissions; adaptation reduces harm or takes suitable action in response to effects. Improving building insulation can reduce energy demand, while flood-resilient planning can reduce exposure. Some actions support both, and choices have costs and distributional effects: benefits and costs may fall on different groups. A useful response needs evidence about effectiveness and who benefits.
Evaluating environmental decisions — Compare options using environmental effects, costs, fairness, feasibility and uncertainty over an appropriate timescale. A tree-planting proposal needs suitable species, land, maintenance and a clear purpose rather than only a large planting count. Explain trade-offs and interactions across places, including whether a claimed local benefit shifts a pressure elsewhere.
Test yourself
50 questions · Random sets of 10. These quick checks support revision; practise longer explanations and justified judgements too.
Mind map
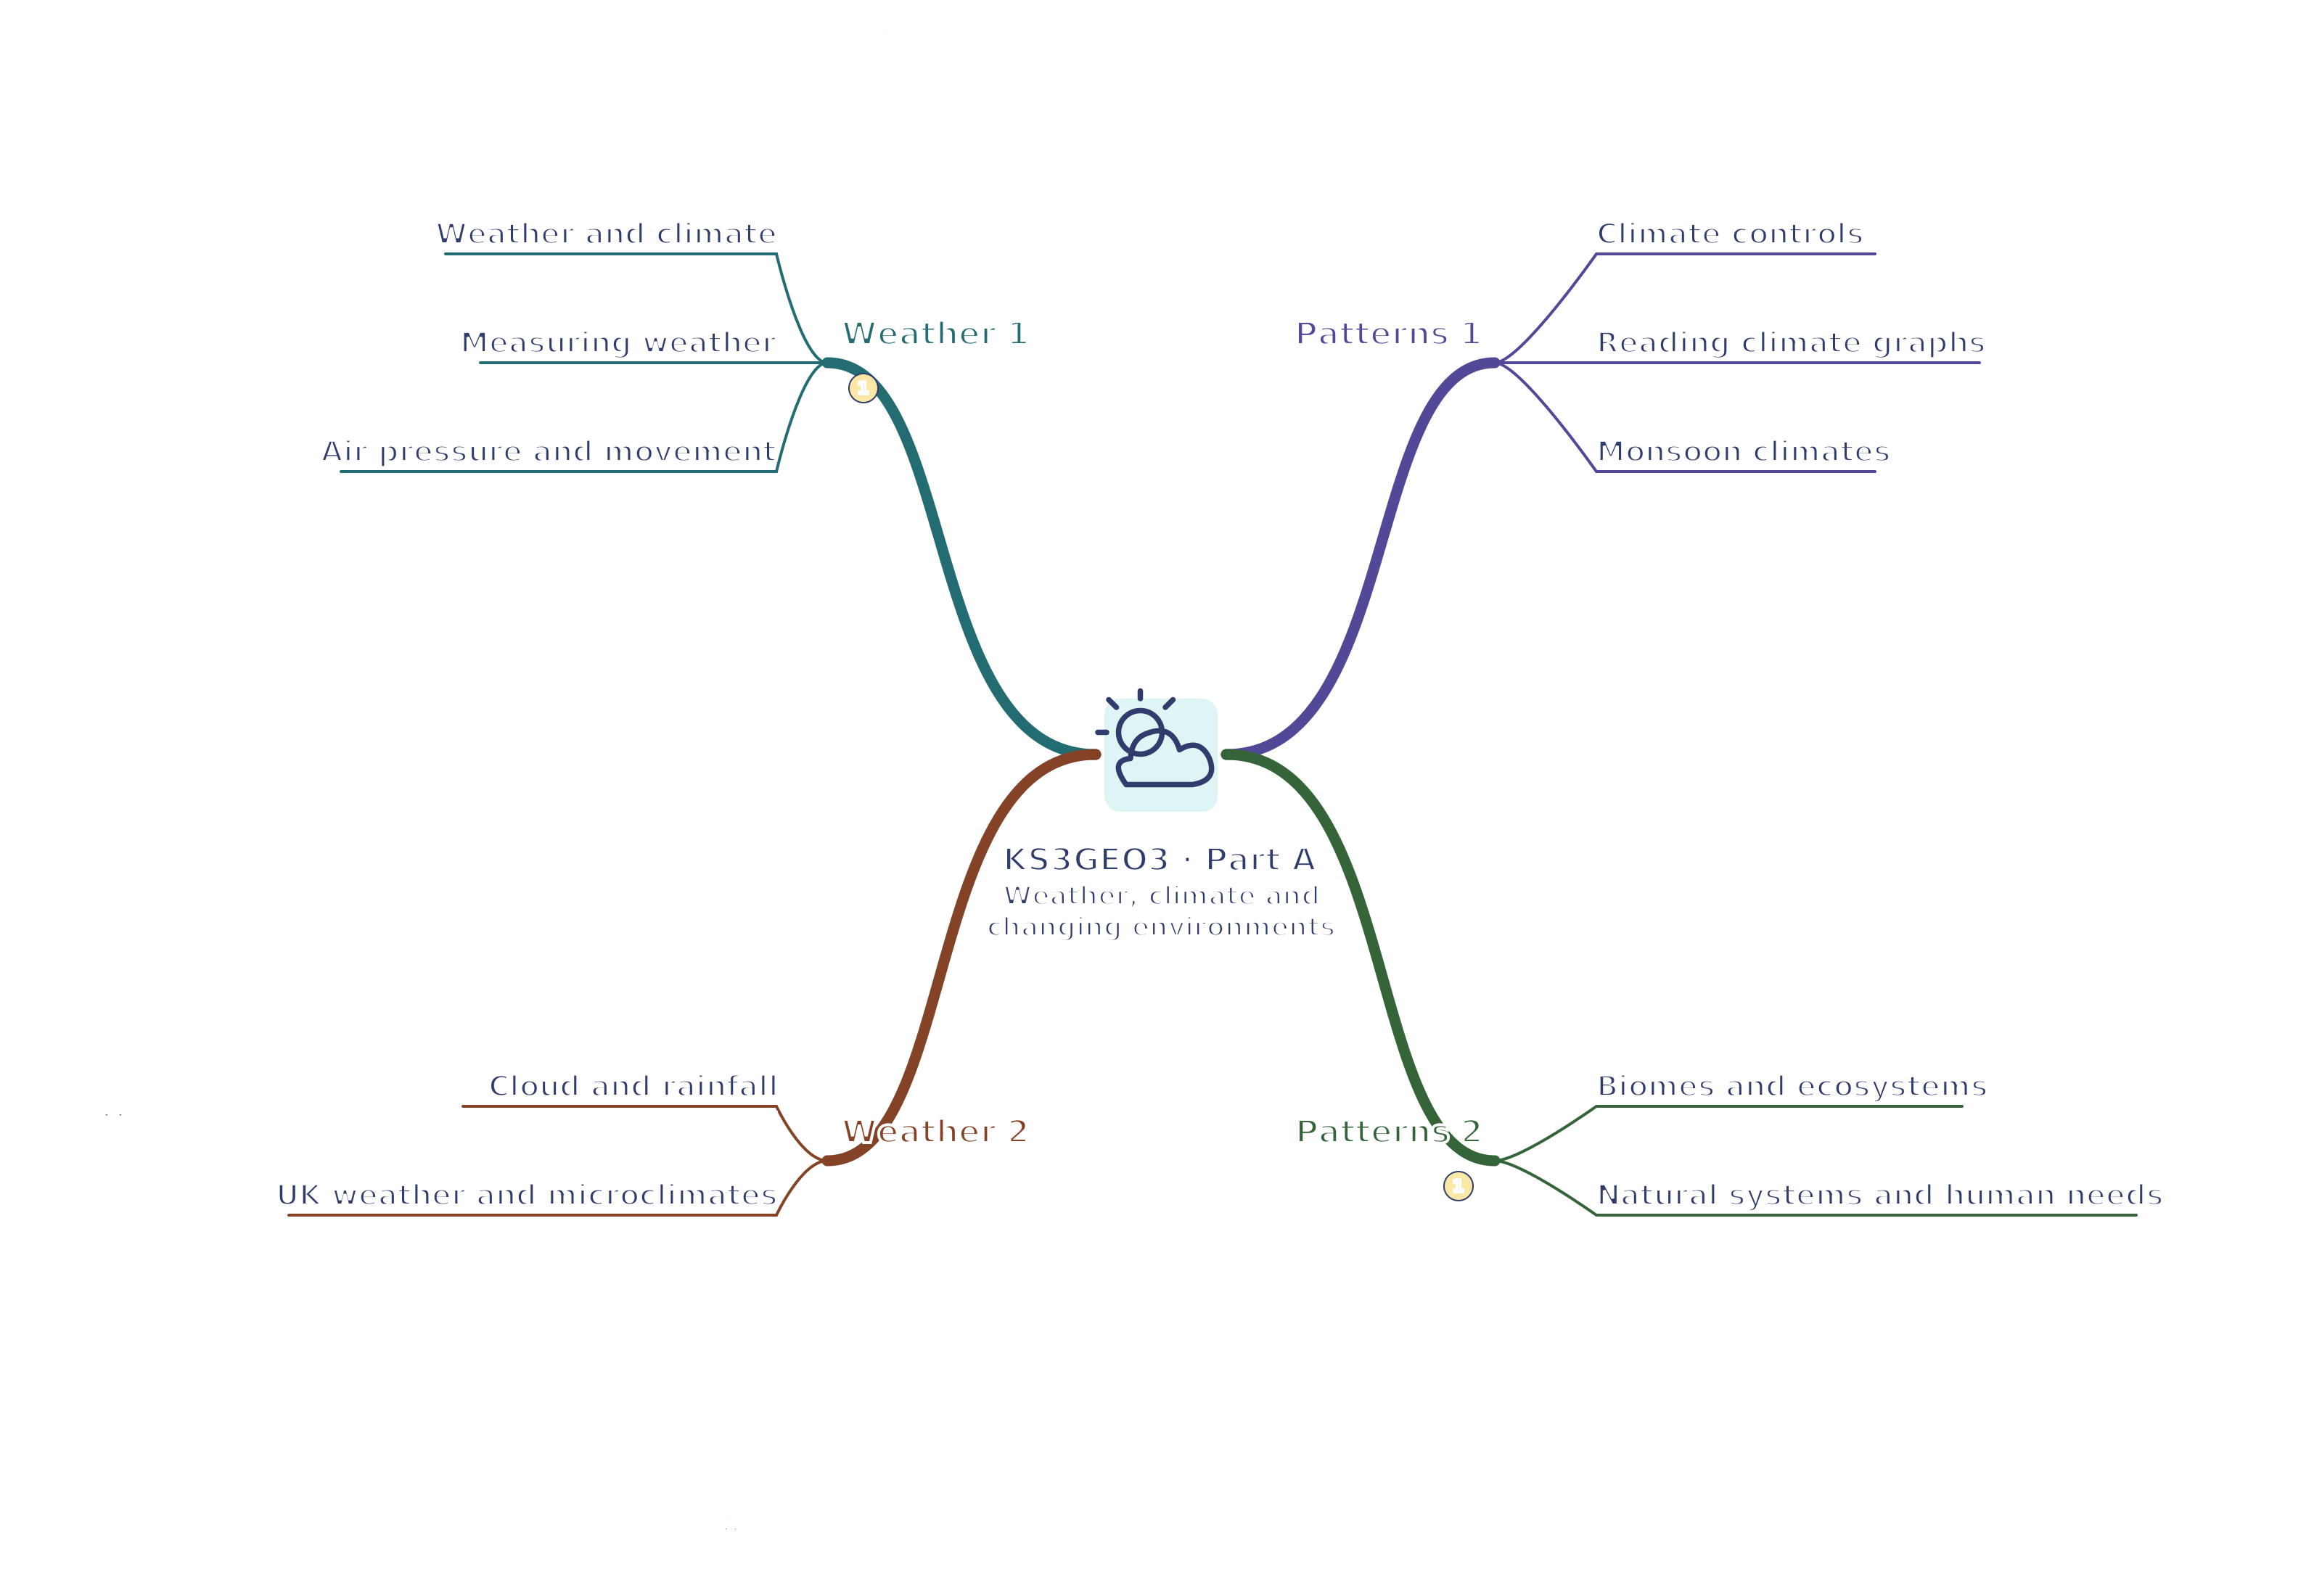
Use the branches to recall the ideas and explain their connections. Check the revision notes for the full detail.
KS3GEO3 · 1
View KS3GEO3 · 1 mind mapOpen the full-size map to zoom. Use the printable view for A4 landscape or enlarge to A3.
 Mr Kidman's Classroom