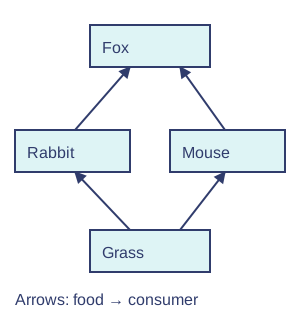
Interdependence — An ecosystem includes organisms and their physical environment. Organisms depend on one another for food, shelter, reproduction and material recycling. A food web shows linked feeding relationships; arrows run from food to consumer, showing transfer of material and energy.Feeding arrows. Original schematic; see the explanation for its limits. Full-size diagram
Reading a food chain — An arrow points from food towards its consumer, showing the direction of material and energy transfer by feeding. Grass → rabbit → fox means the rabbit eats grass and the fox eats the rabbit.
Food webs — Most organisms have several food sources or predators. A food web combines chains; a change in one population can have several effects, so prediction needs the full set of links.Interacting feeding relationships. Original schematic; see the explanation for its limits. Full-size diagram
Decomposers — Decomposers break down dead material and waste. Their activities return mineral nutrients to the environment for uptake by producers; matter is recycled while energy transfers and becomes more dispersed.
Pollinators — Insect pollination supports reproduction of many crops and wild plants. Reduced pollinator populations can affect food security and biodiversity. Some crops are wind-pollinated or reproduce in other ways, so not every crop has the same dependence.
Pollinator dependence — A fall in pollinator abundance can reduce reproduction in plants that rely on those pollinators. Animals feeding on the plants may then be affected. The effect depends on other pollination routes and food sources.
Environment — Light, temperature, water and other organisms affect survival and distribution. Organisms also change their environment: plants provide shade and roots stabilise soil. Investigate patterns with samples while recognising that correlation alone does not establish a cause.
Abiotic and biotic factors — Abiotic factors are non-living features such as temperature, light, water and soil conditions. Biotic factors involve living organisms, such as competition, predators and organisms causing disease. Both can affect distribution (where an organism lives) and abundance (how many there are).
Quadrat estimates — Count plants in several suitably placed quadrats and calculate a mean per unit area. For example, if five 1 m² quadrats contain 3, 4, 5, 2 and 6 plants, the mean is 20 ÷ 5 = 4 plants/m². A comparable 50 m² area would have an estimated 4 × 50 = 200 plants. Estimate a larger area only if the sample is representative; clumping and seasonal change introduce uncertainty.
Toxic materials — Some persistent toxic substances can accumulate in organisms and reach greater concentrations along food chains. Predators may ingest contaminated prey repeatedly. This is not true of every substance; breakdown and excretion affect accumulation.
Bioaccumulation — Some persistent toxic substances accumulate when uptake exceeds removal. Their concentration can increase through some food chains as predators eat contaminated prey. This does not happen equally for every chemical.
Inheritance and variation
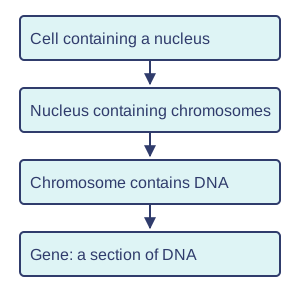
Heredity — Heredity is transmission of genetic information from one generation to the next. Chromosomes contain DNA; genes are sections of DNA associated with inherited characteristics. Sexual reproduction combines information from two parents; environment also influences many characteristics.Genetic information model. Original schematic; see the explanation for its limits. Full-size diagram
Genes and chromosomes — Chromosomes contain long DNA molecules. A gene is a section of DNA associated with a particular function or inherited characteristic. An organism has many genes, not one gene for every cell.Where genetic information is organised. Original schematic; see the explanation for its limits. Full-size diagram
Inherited and environmental variation — Blood group is inherited. A scar is acquired through an environmental event. Features such as body mass are influenced by both inheritance and environment, so not every difference fits one cause alone.
DNA model — Watson and Crick developed the double-helix model using evidence including X-ray work by Franklin and Wilkins and other chemical findings. This illustrates collaboration, use of others' data and historical questions about recognition. A model is justified by evidence, not just famous names.
DNA model limitations — A twisted-ladder drawing represents the shape and organisation of DNA but is not to scale and omits molecular detail. It helps locate genetic information without predicting every characteristic from appearance.
Species — Members of a species generally can reproduce with one another to produce fertile offspring; this useful definition has limits, including asexual organisms. Different species differ in characteristics, while members of one species also vary.
Species and reproduction — Members of a species can usually reproduce with one another to produce fertile offspring, meaning young that can themselves reproduce. This school definition is useful but has limits, including organisms reproducing asexually and some hybrid cases.
Continuous variation — Continuous variation spans a range, such as height. Measure a suitable sample with units and show a distribution using a histogram with intervals. Both genes and environment may contribute; do not infer a single gene from a continuous trait.
Continuous variation — Height can take many values within a range and is recorded with units. Grouped measurements can be shown in a histogram; suitable sampling and measurement precision affect the apparent pattern.Ranges and categories use different displays. Original schematic; see the explanation for its limits. Full-size diagram
Discontinuous variation — Discontinuous variation has distinct categories, such as ABO blood groups. A bar chart shows category frequencies with gaps between bars. Not every trait fits perfectly into one simple classification, and sensitive personal data must be handled appropriately.
Discontinuous variation — Blood groups fall into distinct categories. A bar chart can compare their frequencies, with separate bars for separate categories. Not every characteristic with named categories is determined by one gene.
Natural selection and conservation
Competition — Organisms compete for limited resources such as food, light, water, space and mates. Inherited variation can make some individuals better suited to current conditions; success depends on the environment, not a universal ranking of 'better' organisms.
Competition for resources — Plants may compete for light, water, minerals and space. Animals may compete for food, territory or mates. Competition depends on a limited resource, not simply two organisms living nearby.
Natural selection — Individuals with useful inherited traits may survive and reproduce more successfully, passing those traits on. Across many generations the traits can become more common. Individuals do not deliberately evolve a needed trait; population changes follow inherited variation and selection.Natural selection. Original schematic; see the explanation for its limits. Full-size diagram
Variation before selection — Individuals already vary before a new environmental pressure acts. Some inherited differences affect survival and reproduction. Organisms do not develop a needed inherited feature because they try harder.
Selection over generations — Individuals with a useful inherited feature may leave more surviving offspring. Over many generations that feature can become more common. A population changes; an individual does not evolve during its lifetime.Natural selection over generations. Original schematic; see the explanation for its limits. Full-size diagram
Extinction — Environmental change can leave individuals or whole species poorly adapted. If a species cannot survive and reproduce anywhere, it becomes extinct. Habitat loss, invasive organisms, climate changes and over-exploitation can contribute; predictions require evidence.
Extinction pressures — Habitat loss, new predators, disease or rapid environmental change can reduce a species' survival and reproduction. Extinction occurs when no living individuals remain, not when one local population disappears.
Biodiversity — Biodiversity is the variety of living organisms. Conservation maintains habitats, species and genetic variation, helping ecosystems function and retain future options. Weigh scientific evidence and social needs when judging interventions.
Biodiversity and resilience — Biodiversity includes variety within and between species and ecosystems. Conserving habitats can protect interacting organisms together; the loss of a species may remove functions that other species cannot fully replace.
Gene banks — Seed banks and other gene banks preserve hereditary material. They can support conservation and breeding but cannot replace functioning habitats or guarantee recovery of an extinct species. Stored material needs suitable conditions and ongoing management.
Gene banks and conservation — Seed banks store material from many plant varieties under controlled conditions. They preserve genetic diversity for future use but do not replace functioning habitats or conserve every species by themselves.
Evaluating a conservation claim — Compare evidence about population trends, habitat quality and successful reproduction. A short-term rise in sightings could reflect survey effort rather than a true population recovery.
Test yourself
30 questions · Random sets of 10. These quick checks support revision; practise longer explanations and justified judgements too.
Mind map
Use the branches to recall the ideas and explain their connections. Check the revision notes for the full detail.
View KS3SCI6 · Ecosystems 1 / Ecosystems 2 / Ecosystems 3 / Ecosystems 4 mind mapOpen the full-size map to zoom. Use the printable view for A4 landscape or enlarge to A3.
View KS3SCI6 · Inheritance 1 / Inheritance 2 / Inheritance 3 / Inheritance 4 mind mapOpen the full-size map to zoom. Use the printable view for A4 landscape or enlarge to A3.
View KS3SCI6 · Selection 1 / Selection 2 / Selection 3 / Selection 4 mind mapOpen the full-size map to zoom. Use the printable view for A4 landscape or enlarge to A3.
 Mr Kidman's Classroom