Waves — Waves transfer energy without a net transfer of matter along the wave. In transverse waves, motion is perpendicular to travel direction; surface-water ripples are a useful simplified example. Real water-particle motion is more complex than a purely up-and-down drawing.
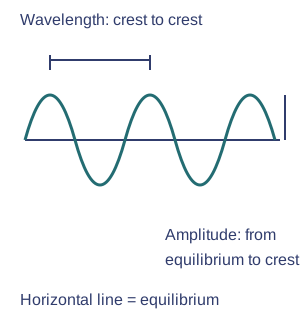
Amplitude and wavelength — Equilibrium is the undisturbed or resting position. Displacement is the distance and direction from it. Amplitude is the greatest distance from equilibrium; wavelength is the distance between matching points on neighbouring cycles of a wave. Measure crest to crest for wavelength and equilibrium to crest for amplitude.Two measurements on a transverse wave. Original schematic; see the explanation for its limits. Full-size diagram
Particles versus wave travel — A cork on a water surface mainly oscillates near its position while the wave pattern moves onward. The model illustrates energy transfer without assuming each particle travels from source to shore.
Superposition — Waves can reflect at a boundary. When waves overlap, their displacements add: matching crests reinforce and a crest meeting an equal trough can cancel temporarily. The waves can continue after passing one another; cancellation does not destroy all energy permanently.
Superposition example — When equal upward and downward displacements overlap, the total displacement can be zero at that moment. The original waves continue after overlapping; temporary cancellation is not permanent disappearance.
Sound — Vibrating objects create sound waves in a medium. Sound is longitudinal: pressure changes travel while particles vibrate parallel to travel direction. Sound cannot cross a vacuum because there are no particles to transmit the disturbance.Longitudinal sound model. Original schematic; see the explanation for its limits. Full-size diagram
Compressions and rarefactions — A sound wave has regions of higher particle density and pressure called compressions and lower-density rarefactions. Particles oscillate along the travel direction, rather than moving with the wave all the way to the listener.Compressions and rarefactions. Original schematic; see the explanation for its limits. Full-size diagram
Frequency — Frequency is oscillations per second, measured in hertz (Hz). Higher frequency generally gives higher pitch; greater amplitude generally gives louder sound. These are different properties. Many young humans hear roughly 20 Hz to 20 kHz, but range varies with age and individual.
Frequency calculation — A source making 120 oscillations in 2 s has frequency 60 Hz. Frequency counts oscillations per second; it is not the speed at which sound travels through the room.
Pitch and loudness — Increasing frequency generally raises pitch. Increasing amplitude generally increases perceived loudness at a given frequency and listening position. Changing one does not necessarily change the other.
Sound travel — Sound speed depends on material and conditions: about 340 m/s in room-temperature air, roughly 1500 m/s in water and often faster in solids. Exact values vary. Echoes are reflected sound; soft materials can absorb sound and reduce reflection.
Echo distance — If sound takes 0.4 s to return from a wall, at 340 m/s it travels 136 m in total. The wall is about 68 m away because the sound travels there and back.
Detection — A loudspeaker's vibrating cone creates pressure waves. A microphone diaphragm responds to them and converts information into electrical signals. In the ear, the eardrum vibrates and structures pass information to the nervous system; sound transfers energy as well as information.
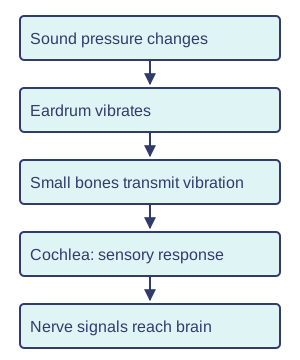
The ear's sequence — Sound makes the eardrum vibrate; small bones pass the vibration towards the inner ear. Sensory cells in the cochlea help convert it into signals carried to the brain. This is a simplified sequence, not a medical test.A simplified hearing pathway. Original schematic; see the explanation for its limits. Full-size diagram
Ultrasound — Ultrasound is sound above the usual human hearing range. Animals have different hearing ranges: bats can use ultrasound beyond human hearing, while some elephants detect very low frequencies. Ultrasound can transfer energy for cleaning and some physiotherapy uses; frequencies and intensity are selected for the purpose and medical use needs trained judgement.
Ultrasound echoes — An ultrasound pulse reflects at suitable boundaries. The return time helps estimate distance when the sound speed is known. An image is constructed from many measurements, not a photograph made by visible light.
Light travel and reflection
Light — Light is an electromagnetic wave and can cross a vacuum. Its speed in a vacuum is about 300 million m/s, much faster than sound in air. Light and waves in matter share reflection and energy transfer, but light needs no material medium.
Lightning and thunder — Light and sound may be produced by the same event, but light reaches a distant observer much sooner. The delay is evidence of different speeds, not necessarily different event start times.
Transmission and absorption — Transparent materials transmit much visible light; opaque materials do not. Some light can be absorbed, transferring energy to the material. Diffuse reflection scatters reflected light in many directions, as from a rough surface. Specular reflection sends parallel incoming rays in one reflected direction, as from a smooth mirror; a rough surface still obeys local reflection rules.
Seeing a non-luminous object — Light from a source reaches the object and some is reflected into the eye. A non-luminous object is not seen in complete darkness because there is no visible light to reflect towards the observer.
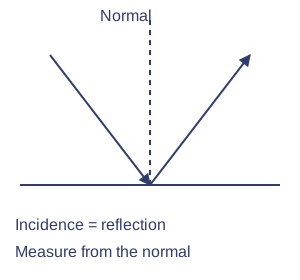
Reflection — The angle of incidence equals the angle of reflection, both measured from the normal perpendicular to the surface. A plane mirror forms an upright virtual image as far behind the mirror as the object is in front; rays appear to come from the image.Reflection from a plane mirror. Original schematic; see the explanation for its limits. Full-size diagram
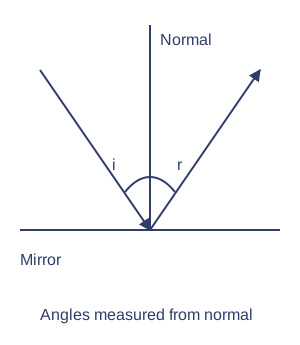
Normal and angles — Draw the normal at right angles to the reflecting surface at the point of incidence. Measure both angles from this line, not from the mirror. An angle of 30° to the mirror is 60° to the normal.Reflection angles use the normal. Original schematic; see the explanation for its limits. Full-size diagram
Virtual mirror image — Reflected rays reach the eye as though they came from behind the mirror. The image cannot be caught on a screen placed there; the light has not actually passed through to that position.
Pinhole camera — Rays travel approximately in straight lines through a small hole, forming an inverted image on the opposite screen. Rays from the top of an object reach the bottom of the image. A smaller hole can sharpen the image but lets in less light.
Pinhole inversion — Rays from the top and bottom of an object cross at the small hole. This places the top at the bottom of the screen image and the bottom at the top. No lens is required for this arrangement.
Refraction, colour and the eye
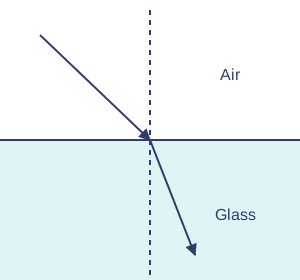
Refraction — Light changes speed at a boundary between materials and can change direction. Going from air into glass at an angle to the normal (obliquely), it bends towards the normal; leaving glass for air, it bends away. A ray along the normal changes speed but not direction.Ray entering glass. Original schematic; see the explanation for its limits. Full-size diagram
Refraction and speed — A ray entering glass from air obliquely slows and bends towards the normal. At normal incidence it slows without turning. Refraction therefore does not always mean a visible bend.
Convex lenses — A convex lens can bring parallel rays towards a focus through refraction. A suitable object position gives a real image on a screen. Image position and size depend on object distance; not every lens diagram represents every possible object position.
Focusing with a convex lens — The principal axis is the straight line through the lens centre, perpendicular to the lens. Parallel rays close to this axis converge, meaning they come together, towards a focus. A screen must be placed at the image position to obtain a sharp real image. A blurry image may reflect poor screen position, not failure to transmit light.
Eye — The cornea and lens focus light onto the retina. Photosensitive retinal cells respond and signals reach the brain through the optic nerve. Cameras also focus light onto photosensitive material or sensors. The iris adjusts the size of the pupil, the opening through which light enters. The cornea and lens focus light; the pupil is not a focusing lens.
Eye and camera comparison — The eye focuses light on the retina; a camera focuses it on a sensor or film. Both need a focusing system and a light-sensitive surface. Neither detects light by sending rays out at the object.
Energy effects — Light transfers energy from source to absorber. It can cause chemical effects in photosensitive materials and electrical effects in sensors or solar cells. Seeing is not caused by rays leaving the eyes; light must reach the eye from a source or reflecting object.
Colours — Visible colours correspond to different frequencies of light. White light contains a range of colours; a prism separates them because refraction varies with colour. The prism does not create colours absent from the incoming white light.
Prism dispersion — Different visible wavelengths refract by different amounts in glass, separating white light into a spectrum. A prism redirects existing colours; it does not manufacture them.
Colour and surfaces — A red object under white light diffusely reflects red light more than other visible colours and absorbs much of the rest. Under blue illumination it may look dark because little blue is reflected. Filters transmit selected colours and absorb others; appearance depends on illumination.
Coloured illumination — A surface looks bright only if it reflects light present in the illumination towards the eye. A red surface can appear dark under blue light because it absorbs much of that available light.
Investigation — Trace rays using a low-power ray box and labelled normals; never look into a laser or towards the Sun. Measure angles carefully, control material and repeat. Compare ray predictions with observations and state that ray diagrams simplify wave behaviour.
Ray investigation evidence — Mark the boundary, point of incidence and normal before measuring. Repeat comparable angles and identify uncertainty from beam width and protractor reading. Use teacher-approved light sources and never view the Sun through optical equipment.
Test yourself
30 questions · Random sets of 10. These quick checks support revision; practise longer explanations and justified judgements too.
Mind map
Use the branches to recall the ideas and explain their connections. Check the revision notes for the full detail.
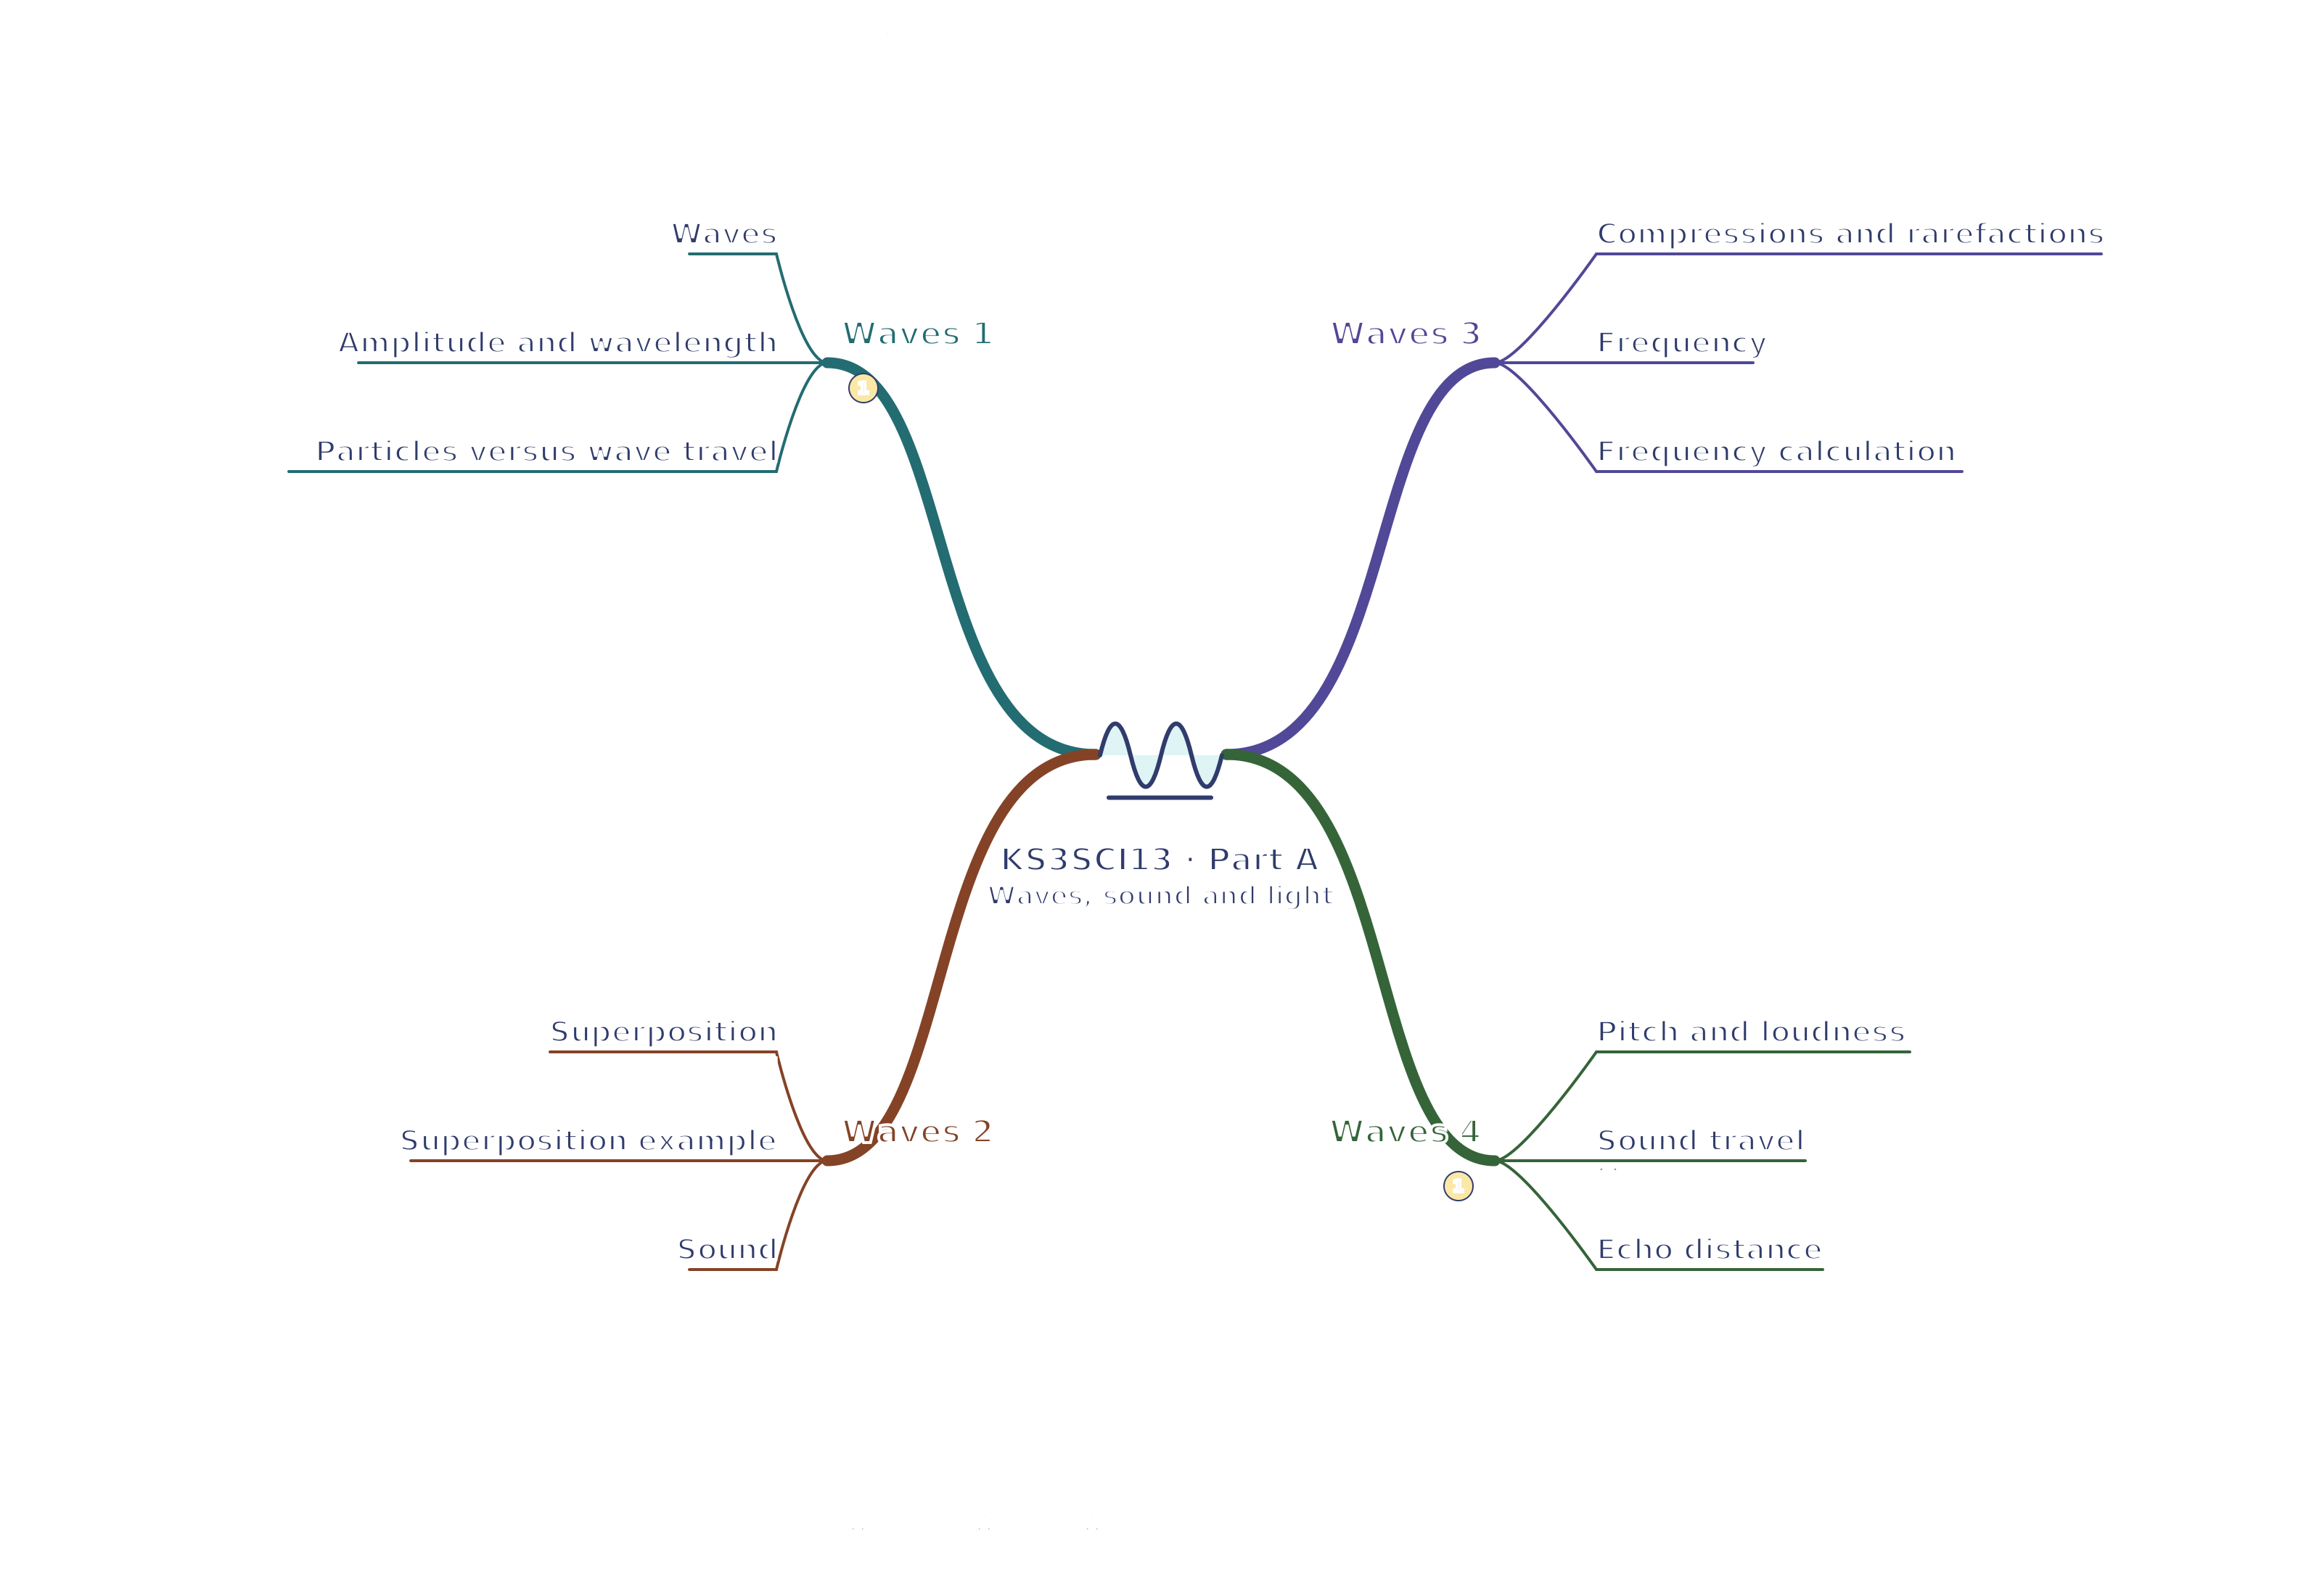
KS3SCI13 · Waves 1 / Waves 2 / Waves 3 / Waves 4
View KS3SCI13 · Waves 1 / Waves 2 / Waves 3 / Waves 4 mind mapOpen the full-size map to zoom. Use the printable view for A4 landscape or enlarge to A3.
View KS3SCI13 · Waves 5 / Waves 6 / Light 1 / Light 2 mind mapOpen the full-size map to zoom. Use the printable view for A4 landscape or enlarge to A3.
View KS3SCI13 · Light 3 / Refraction 1 / Refraction 2 / Refraction 3 mind mapOpen the full-size map to zoom. Use the printable view for A4 landscape or enlarge to A3.
 Mr Kidman's Classroom