Connect photosynthesis to energy transfer — Photosynthesis transfers energy from absorbed light into chemical processes that support synthesis of organic molecules. It does not create energy or convert light directly into matter. Carbon atoms in the carbohydrates ultimately come from carbon dioxide, while the light-dependent reactions supply ATP and reducing power used in carbon assimilation.
Relate chloroplast compartments to reactions — Thylakoid membranes contain photosynthetic pigments, electron carriers and ATP synthase. The fluid stroma contains enzymes for carbon fixation and subsequent reactions of the Calvin cycle. The thylakoid lumen and stroma form distinct compartments, allowing a proton electrochemical gradient to be maintained across the membrane.
Explain pigment absorption — Chlorophyll and accessory pigments absorb particular wavelength ranges, while other wavelengths are reflected or transmitted. An absorption spectrum measures light absorption by pigments; an action spectrum relates wavelength to a photosynthetic response. Their relationship supports a role for pigments, but they are not the same measured variable.
Explain photoionisation — Light absorption raises the energy of electrons in chlorophyll. Electrons can leave a reaction-centre chlorophyll and enter an electron-transfer pathway, so the chlorophyll is photoionised. Replacement electrons are needed to restore its ability to participate; electrons are transferred between carriers rather than created from light.
Trace water splitting — Photolysis supplies replacement electrons and contributes protons, while releasing oxygen. A useful half-equation is 2H₂O → 4H⁺ + 4e⁻ + O₂. The oxygen released in this process derives from water, not directly from splitting the incoming carbon dioxide into carbon and oxygen.
Explain electron transfer and proton accumulation — As electrons pass through a suitable carrier pathway, some transferred energy supports proton movement from the stroma into the thylakoid lumen. Water splitting also contributes protons on the lumen side. The resulting unequal proton distribution stores potential for work across the membrane; it is not ATP itself.
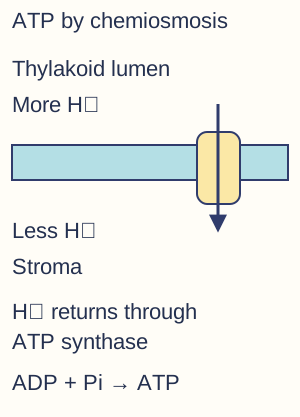
Explain chloroplast chemiosmosis — Protons pass from the lumen to the stroma through ATP synthase down their electrochemical gradient. This flow is coupled to formation of ATP from ADP and inorganic phosphate. An intact membrane and the proton gradient are essential to the coupling; unrestricted proton leakage would reduce ATP synthesis even if some electron transfer continued.The proton gradient across the named membrane drives return through ATP synthase. This orientation shows the high-proton compartment above; pumping and electron carriers are omitted to focus on the coupling step.
Describe reduced NADP formation — Electrons re-energised in the light-dependent system and protons are used to reduce NADP. NADP is a coenzyme, a reusable helper molecule for enzyme-controlled reactions. When it accepts electrons and hydrogen it becomes reduced NADP; it can later donate them. Reduced NADP carries reducing power to reactions that convert carbon compounds into more reduced organic molecules. NADP is a reusable carrier rather than a permanent structural part of every sugar produced.
Link products without confusing their roles — ATP supplies transferable energy and phosphate-associated reaction coupling, whereas reduced NADP supplies reducing power in the Calvin cycle. Both are produced through light-dependent processes and used in carbon assimilation. Oxygen is released as a by-product of photolysis; it is not the molecule that carries the electrons into GP reduction.
The Calvin cycle and limiting factors
Fix carbon dioxide with rubisco — In the stroma, rubisco catalyses combination of carbon dioxide with the five-carbon acceptor ribulose bisphosphate (RuBP). This incorporation of inorganic carbon into an organic molecule is carbon fixation. The initially formed six-carbon intermediate yields two three-carbon GP molecules. RuBP is regenerated in the cycle rather than consumed once for each leaf's entire lifetime.
Reduce GP to triose phosphate — ATP and reduced NADP support conversion of glycerate 3-phosphate (GP) into triose phosphate (TP), a three-carbon phosphorylated sugar. Reduced NADP is oxidised back to NADP, while ATP use returns ADP and inorganic phosphate to the linked processes. The label light-independent means these steps do not directly absorb photons, not that they normally operate indefinitely without light-derived supplies.
Regenerate the carbon acceptor — Most triose phosphate remains within reactions regenerating RuBP, requiring ATP. For three carbon dioxide molecules fixed, six triose phosphates are formed at that stage; five equivalents regenerate three RuBP molecules and one is available as a net three-carbon product. Track carbon atoms rather than claiming all newly formed triose phosphate leaves the cycle.
Use the net products — Triose phosphate can contribute to synthesis of hexose sugars, starch and other organic compounds. With appropriate additional elements and pathways, assimilated carbon can also contribute to amino acids and lipids. Photosynthesis supplies carbon skeletons, but a plant still requires mineral nutrients such as nitrogen rather than making every atom from carbon dioxide and water.
Predict short-term metabolite changes — If carbon dioxide supply falls while light-dependent supplies initially remain available, carbon fixation slows, GP formation tends to decline and RuBP can accumulate. If light is removed, ATP and reduced NADP supplies fall; GP reduction slows and GP can accumulate while RuBP regeneration declines. Interpret the stated time scale and conditions rather than treating every eventual steady state as identical.
Explain limiting-factor graphs — A rate may rise with light intensity until another requirement limits it, producing a plateau. Increasing carbon dioxide at the plateau can increase the rate if carbon dioxide had become limiting. Temperature influences enzyme-catalysed steps and can alter other processes; a factor is limiting in relation to the actual conditions, not because it is always the smallest numerical value on a graph.
Evaluate temperature effects — At low temperatures, enzyme-controlled carbon-assimilation reactions can be slow. A moderate increase can raise rates, while excessive temperature can disrupt enzymes, membranes and water balance. The overall response depends on species and conditions; photosynthesis does not increase without limit as temperature rises.
Evaluate agricultural controls — Supplementary light, carbon dioxide enrichment and temperature management can raise production when they relieve actual limitations. Compare crop yield gains against energy cost, carbon dioxide supply, water, nutrients and environmental consequences. Increasing all inputs beyond biological or economic requirements is not automatically efficient.
Pigment chromatography and chloroplast practicals
Separate leaf pigments — In required practical 7, extract pigments from appropriate leaf samples using the approved solvent method, then apply a small concentrated spot or line to the stationary phase. Keep the origin above the starting solvent level and mark the solvent front promptly. Separation depends on differing interactions with the moving solvent and stationary material, not simply on pigment colour.
Calculate and compare Rf values — Rf equals pigment distance from the origin divided by solvent-front distance from the same origin. A pigment travelling 36 mm with a 60 mm front has Rf = 0.60, with no units. Compare results only under suitably matched solvent, stationary-phase and other conditions; one Rf value is not an infallible identity independent of the method.
Interpret leaf-pigment comparisons — Compare band number, position and suitable intensity measures between replicated samples, controlling extraction mass and volume where relevant. Differences can reflect pigment composition, concentration or extraction efficiency. A faint band is not proof that a plant contains no pigment, and appearance alone does not establish a shade-adaptation mechanism.
Use a redox indicator with chloroplast extracts — Required practical 8 investigates a named factor affecting a chloroplast extract's dehydrogenase-related activity using an appropriate electron-accepting indicator such as DCPIP. Reduced indicator changes colour, providing a measurable proxy for electron transfer under the assay conditions. This is not direct measurement of whole-plant carbon dioxide fixation.
Control the chloroplast assay — Use comparable fresh chloroplast preparations, volumes, indicator concentration and temperature; vary only the named factor where practicable. Suitable dark, boiled-extract or no-extract controls address different explanations and should be chosen to test the hypothesis. Account for pigment colour and instrument blanking when measuring absorbance.
Calculate indicator-change rate — Measure a reproducible absorbance change per unit time or use the reciprocal of time to a specified endpoint as a relative-rate proxy when justified. If a fixed endpoint takes 40 s, 1/t is 0.025 s⁻¹. Compare initial changes where possible and explain why different starting concentrations or subjective endpoint judgments can invalidate a simple comparison.
Glycolysis and anaerobic pathways
Locate glycolysis and identify its role — Glycolysis takes place in the cytoplasm and does not itself require oxygen. It begins breakdown of glucose in both aerobic and anaerobic pathways. Calling glycolysis anaerobic does not mean it stops whenever oxygen is present; its products can feed different subsequent routes.
Trace glucose phosphorylation and splitting — ATP is invested in phosphorylation steps that make the six-carbon substrate more reactive. The pathway yields two three-carbon triose-phosphate molecules for subsequent reactions. The initial ATP cost must be included when calculating the net rather than gross yield.
Explain glycolytic oxidation and ATP production — Oxidation of the triose-phosphate intermediates produces reduced NAD and ultimately two pyruvate molecules per glucose. ATP forms by substrate-level phosphorylation. In the standard glucose accounting model, four ATP are formed after two have been invested, giving a net gain of two ATP and two reduced NAD per glucose.
Regenerate NAD during anaerobic metabolism — For glycolysis to continue, reduced NAD must be reoxidised so oxidised NAD remains available to accept further hydrogen or electrons. Anaerobic product formation can accomplish this when the aerobic electron-transfer route cannot operate sufficiently. The conversion's essential purpose is not to produce a large extra ATP yield after glycolysis.
Compare lactate and ethanol pathways — In lactate formation, pyruvate is reduced to lactate while reduced NAD is oxidised; no carbon dioxide is released in that conversion. In yeast ethanol formation, pyruvate loses carbon dioxide and the resulting compound is reduced to ethanol, regenerating NAD. Different end products reflect different pathways, not a universal conversion of all pyruvate into the same substance.
Explain the lower anaerobic ATP yield — Anaerobic conversion leaves substantial chemical energy in lactate or ethanol and does not feed the full aerobic oxidation sequence. Only the small net glycolytic ATP yield is obtained in the simple pathway model. Avoid saying that anaerobic respiration releases no energy or that every glucose molecule is completely oxidised to carbon dioxide.
Link reaction and Krebs cycle
Transport pyruvate into mitochondria — Under aerobic conditions in a suitable eukaryotic cell, pyruvate from cytoplasmic glycolysis enters the mitochondrial matrix through transport mechanisms. The cytoplasm and matrix are distinct locations. Bacteria do not require mitochondria to respire; their compartment and membrane arrangements differ from this eukaryotic model.
Trace the link reaction — Each three-carbon pyruvate is oxidised and decarboxylated, generating reduced NAD and carbon dioxide. Decarboxylation means removal of a carboxyl group as carbon dioxide; the loss explains the change from three carbons to two. The remaining two-carbon acetyl group combines with coenzyme A to form acetylcoenzyme A. Per glucose, two pyruvate molecules give two acetyl groups, two carbon dioxide molecules and two reduced NAD in this stage.
Enter the Krebs cycle — The two-carbon acetyl group combines with a four-carbon acceptor to form a six-carbon intermediate, releasing coenzyme A for reuse. Subsequent reactions restore the four-carbon acceptor, allowing the cycle to continue. Regeneration explains why the acceptor does not need to be supplied anew for every turn.
Explain cycle oxidation and carbon loss — A sequence of enzyme-controlled oxidation and decarboxylation reactions produces carbon dioxide and reduced coenzymes, including reduced NAD and reduced FAD. A small amount of ATP or equivalent nucleotide energy forms by substrate-level phosphorylation. Most of the stage's transferable energy is carried onwards in reduced coenzymes rather than immediately converted into ATP.
Keep per-turn and per-glucose accounting distinct — In the standard model, each acetyl group yields two carbon dioxide, three reduced NAD, one reduced FAD and one ATP-equivalent per cycle turn. One glucose supplies two acetyl groups, so double these figures for the cycle contribution per glucose. State whether the question includes glycolysis and the link reaction as well as the cycle.
Oxidative phosphorylation and respiratory substrates
Trace electron transfer in mitochondria — Reduced NAD and reduced FAD donate electrons to an electron-transfer system associated with the inner mitochondrial membrane. Oxidation regenerates the coenzymes for earlier pathways. Electron-transfer reactions support proton movement from the matrix towards the intermembrane space, creating an electrochemical gradient.
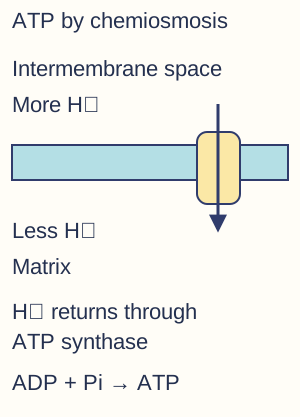
Explain mitochondrial chemiosmosis — Protons return from the intermembrane space to the matrix through ATP synthase. The enzyme couples that flow to ATP synthesis from ADP and inorganic phosphate. Cristae provide extensive inner-membrane area for these systems; ATP synthase is not a pore allowing arbitrary free leakage without coupling.The proton gradient across the named membrane drives return through ATP synthase. This orientation shows the high-proton compartment above; pumping and electron carriers are omitted to focus on the coupling step.
Identify oxygen's final role — Oxygen acts as the final electron acceptor in the aerobic electron-transfer pathway and combines with electrons and protons to form water. Oxygen is not directly required for the carbon-cleavage step of glycolysis, but its absence restricts coenzyme regeneration through this pathway and therefore affects sustained aerobic metabolism.
Distinguish phosphorylation mechanisms — Substrate-level phosphorylation transfers a phosphate group to ADP through an enzyme-catalysed reaction involving a substrate. Oxidative phosphorylation links ATP synthesis to respiratory electron transfer and chemiosmosis. Photophosphorylation uses light-driven electron-transfer processes; the shared ATP product does not make the driving energy source identical.
Predict effects of inhibitors and uncoupling — An inhibitor of electron transfer can reduce proton pumping and ATP synthesis, while an uncoupler dissipates the proton gradient without producing the usual ATP. Some electron transfer or oxygen consumption can continue under uncoupling even as ATP yield falls. Use the stated target rather than assuming every poison affects the same stage.
Avoid one inflexible ATP total — Aerobic metabolism generally yields much more ATP per glucose than glycolysis alone, but actual yield depends on coupling, transport costs and conditions. Use totals and conventions supplied in a question rather than declaring one textbook integer universal for all cells. A comparison should distinguish theoretical stoichiometry from measured cellular yield.
Use fats and amino acids as substrates — Lipid breakdown yields glycerol and fatty acids that enter respiratory metabolism through appropriate pathways, with fatty acids supplying acetyl groups. Amino acids can be deaminated and their remaining carbon skeletons enter at suitable points. Nitrogen removal and waste handling distinguish amino-acid use from simply treating all substrates as glucose molecules.
Investigating respiration in microorganisms
Design a named-variable culture investigation — Required practical 9 uses cultures of single-celled organisms to investigate a respiration-rate variable. Choose an approved organism and method, specify temperature or substrate concentration as appropriate, and control cell amount, volume, pH, time and other relevant factors. Standardise acclimatisation and use repeats rather than changing several conditions together.
Interpret gas and redox measurements — Oxygen uptake can indicate aerobic respiration, while carbon dioxide output depends on pathway and substrate. A redox indicator provides a proxy for a transfer reaction under the assay conditions. The chosen measurement must match the process being investigated; lack of carbon dioxide in one pathway does not prove absence of all ATP production.
Explain a respirometer — A sealed respirometer can measure gas-volume changes while carbon dioxide is absorbed by an appropriate reagent, so a decrease can reflect oxygen uptake. Maintain temperature, prevent leaks, use a suitable control and keep absorbent separated safely from organisms. Gas volume changes also respond to temperature and pressure, so an uncontrolled apparatus does not isolate metabolism.
Normalise and evaluate respiratory rates — Divide measured uptake by time and, when comparing unequal samples, by cell number, biomass or another justified amount. A 0.60 cm³ oxygen decrease over 10 min for 0.20 g biomass gives 0.30 cm³ g⁻¹ min⁻¹. Explain detection limits, lag phases and whether the measured interval supports a constant-rate assumption.
Biomass, production and energy transfer
Define biomass and dry-mass measurement — Biomass is biological material whose amount can be represented by dry mass or carbon content under stated conditions. Dry a sample using an appropriate method to constant mass and account for sample area or volume. Fresh mass is affected by water content and therefore is not directly comparable to dry organic matter without qualification.
Estimate stored energy by calorimetry — Combusting a known dry mass can transfer energy to a known water mass, estimated using E = mcΔT with an appropriate specific heat capacity. If 100 g water rises by 12°C and c = 4.18 J g⁻¹ °C⁻¹, the measured transfer is 5016 J. Divide by burned sample mass for a mass-specific estimate, recognising heat losses and incomplete combustion.
Distinguish standing biomass and productivity — Standing biomass is a quantity present at a stated time, while productivity is a rate of production per area or volume per time. A small standing crop can have rapid turnover and high annual production. State units such as g m⁻² for biomass and kJ m⁻² year⁻¹ for energy productivity rather than interchanging them.
Calculate net primary production — Gross primary production represents total fixation into chemical energy stores before producer respiratory losses are deducted. Net primary production is GPP − R and supports growth, reproduction and availability to consumers or decomposers. If GPP is 18000 kJ m⁻² year⁻¹ and R is 11000 in the same units, NPP is 7000 kJ m⁻² year⁻¹.
Account for consumer production — For the stated energy budget, net consumer production N = I − (F + R), where I is ingested energy, F is losses in faeces and urine as defined, and R is respiratory loss. If I = 5000 kJ, F = 1800 kJ and R = 2400 kJ for one interval, N = 800 kJ. Keep the interval and the definition of each term consistent.
Explain trophic-transfer losses — Not all biomass is eaten, not all eaten material is assimilated, and assimilated energy can be transferred to the environment during respiration. Uneaten matter and waste can support decomposers rather than simply disappearing. Energy is transferred and dissipated through pathways; it is not recycled in the same way as nutrient atoms.
Calculate transfer efficiency — Efficiency equals useful output divided by the specified input, multiplied by 100%. If 900 kJ of consumer production results from 6000 kJ of producer production, the stated transfer efficiency is 15%. Using ingested energy instead would answer a different question, so identify the denominator before calculating.
Evaluate farming energy efficiency — Reducing transfer to pests or other nonhuman food chains can increase harvested production, while managing animal temperature or movement can reduce some respiratory expenditure. Evaluate feed and heating costs, animal welfare, disease, biodiversity and environmental effects. Higher production efficiency in one narrow energy budget does not alone establish that a practice is desirable overall.
Decomposition, mycorrhizae and nutrient cycling
Distinguish nutrients from energy flow — Atoms of elements such as nitrogen and phosphorus can move repeatedly between organisms and their physical environment. Energy enters most food webs through light capture and is progressively transferred to the surroundings, requiring continuing input. A nutrient cycle therefore cannot be used as a diagram of energy being reused indefinitely without loss.
Explain saprobiont decomposition — Saprobionts release enzymes onto dead organic material and absorb soluble digestion products. Decomposition releases nutrients into forms available for other organisms, while decomposer respiration transfers energy and produces carbon dioxide. Rate depends on conditions including temperature, water availability, oxygen and the substrate; not all decomposers are bacteria.
Explain mycorrhizal associations — Fungal hyphae, fine branching threads forming the body of a fungus, associated with plant roots extend the effective region of resource exploration and can facilitate uptake of water and mineral ions, especially under limiting conditions. The fungus receives organic carbon from the plant. Describe the exchange and context rather than assuming the association always provides the same net benefit in every soil.
Trace the phosphorus cycle — Weathering can release phosphate from rocks into soil or water, plants absorb suitable inorganic phosphate and food chains transfer phosphorus into consumers. Waste and dead material return phosphorus through decomposition, while runoff, sedimentation and geological processes connect further stores. Unlike nitrogen, the ordinary phosphorus-cycle model has no major atmospheric gas phase.
Nitrogen transformations and fertiliser effects
Explain nitrogen fixation — Nitrogen-fixing microorganisms convert atmospheric nitrogen gas into biologically usable reduced nitrogen compounds. Suitable free-living or plant-associated bacteria can contribute, with root-nodule associations supplying fixed nitrogen in exchange for plant resources. Fixation is not the same process as plants absorbing nitrate already present in soil.
Explain ammonification — Decomposition of nitrogen-containing organic compounds can release ammonium through microbial metabolism. This returns nitrogen from proteins and other organic material to inorganic forms. Ammonification differs from nitrogen fixation because it does not begin with atmospheric nitrogen gas.
Explain nitrification — Nitrifying microorganisms oxidise ammonium through nitrite to nitrate under suitable oxygenated conditions. Plants can absorb nitrate and use its nitrogen in synthesising amino acids and other compounds. Distinguish nitrite and nitrate and do not reverse this oxidation pathway with denitrification.
Explain denitrification — Under suitable low-oxygen conditions, denitrifying microorganisms can reduce nitrate to gaseous nitrogen products, returning nitrogen towards the atmosphere. Waterlogging can promote such conditions by limiting oxygen availability. This pathway can decrease soil nitrate available to crops; it is not the process of absorbing nitrate through a root hair.
Explain fertiliser replacement and leaching — Harvest removes nitrogen and phosphorus in biomass, so natural or manufactured fertilisers can replenish limiting nutrients. Soluble nitrate can move with draining water beyond roots and into waterways. Match amount, timing and placement to crop needs; adding more than uptake requires can increase losses without proportional yield improvement.
Trace eutrophication mechanistically — Extra nitrate or phosphate can stimulate growth of algae or other producers where those nutrients were limiting. Increased shading and subsequent death provide more organic material for decomposers; elevated microbial respiration can reduce dissolved oxygen and harm oxygen-dependent organisms. Do not state that algae directly remove all oxygen simply because they photosynthesise.
Investigate mineral requirements — Compare suitable plants in controlled nutrient solutions differing in the named ion, while controlling light, temperature, initial size, pH and other nutrients. Measure growth with a defined outcome and repeats, and avoid contaminating a supposed deficiency treatment. A short experiment's lack of a visible symptom does not prove the ion is unnecessary if stored reserves remain.
Test yourself
50 questions · Random sets of 10. These quick checks support revision; practise longer explanations and justified judgements too.
 Mr Kidman's Classroom