Distinguish mass and niche markets — A mass-market business addresses a broad customer base, often using standardised products and scale to spread costs. A niche business targets a more specific group with particular needs. A niche can support differentiation and higher prices but may limit sales volume and increase dependence on one segment; a large market is not automatically profitable for every entrant.
Measure market size and share — Market size can be measured by sales volume or sales value over a defined period and geographical or product boundary. Market share is a firm's comparable sales divided by total market sales, multiplied by 100%. A fictional firm selling £12 million in a £150 million market has an 8% value share; do not divide its volume by market value or compare different periods.
Interpret growth and changing shares — A growing firm's sales can coexist with falling share if the market grows faster. If firm sales rise from £12 million to £13.2 million while the market rises from £150 million to £180 million, firm growth is 10% but share falls from 8% to about 7.33%. Distinguish percentage sales growth from the percentage-point change in share.
Explain dynamic markets — Technology, preferences, incomes, demographics, regulation and new competitors can change demand and business models. Online retailing can widen reach and make comparison easier while introducing fulfilment costs (the costs of processing, packing and delivering orders), platform dependence and rapid imitation. A successful response requires evidence about the relevant change rather than assuming every firm should copy the same digital strategy.
Relate innovation and competition — A new product, process or business model can attract customers or lower costs, but rivals may imitate it and customers may not adopt it. Competition can encourage quality and efficiency while squeezing margins. Evaluate an innovation through likely demand, defensibility, implementation cost and the firm's resources, not novelty alone.
Separate risk and uncertainty — Risk concerns outcomes for which probabilities can be estimated usefully, while uncertainty concerns situations where reliable probabilities are unavailable or unstable. Historical defect rates can inform an insurance decision; an unprecedented market disruption is harder to quantify. A numerical forecast does not automatically turn an uncertain future into a known probability distribution.
Market research and segmentation
Compare product and market orientation — A product-oriented approach starts from what the firm can design or make, while a market-oriented approach emphasises understanding customer requirements. Technical innovation can reveal needs customers could not initially describe, and customer evidence can prevent costly unwanted features. Most sound decisions connect capabilities with demand rather than treating one orientation as universally superior.
Choose primary research for the question — Primary research gathers new information for a defined purpose, using methods such as questionnaires, interviews, focus groups, observations or trials. A survey can estimate stated preferences, while observation or a controlled trial may reveal actual behaviour. Specificity and control can be valuable, but design, fieldwork and analysis require time and money.
Evaluate secondary research — Existing sales records, published statistics, trade reports and other sources can provide rapid context and trend evidence. Check date, definitions, coverage, collection method and potential commercial bias. A large national dataset may still be poorly matched to a small local target group; free availability does not establish relevance or accuracy.
Distinguish quantitative and qualitative evidence — Quantitative data support numerical comparisons such as purchase frequencies, while qualitative evidence explores meanings, motives or experiences. A focus-group explanation can suggest why customers dislike packaging but does not alone quantify how common that view is. Use methods together when a decision needs both prevalence and explanation.
Evaluate samples and questions — A larger sample can reduce sampling variation when the selection method is sound, but size does not cure a systematically unrepresentative sample. Leading wording, nonresponse, convenience selection and stated-intention gaps can distort results. Explain the direction of a likely bias where possible rather than merely labelling all research unreliable.
Use digital research critically — Website analytics, online reviews, social interactions and customer databases can reveal patterns quickly. Platform users may differ from the full market, multiple accounts can distort counts and clicks need not become profitable purchases. Use appropriate consent and data handling, and distinguish a large accessible dataset from a representative one.
Segment customers purposefully — Segmentation groups customers using relevant characteristics such as needs, location, income, age, lifestyle or behaviour. The firm can adapt its offer and communication to a segment it can identify and reach economically. Avoid stereotypes: a demographic label alone does not establish that every member has the same preferences or willingness to pay.
Positioning, differentiation and added value
Interpret a market map — A market map plots competitors against two selected attributes, such as perceived quality and price. It can reveal clustering or an apparent gap, but positions depend on measurement and customer perceptions. A blank area is not proof of profitable unmet demand; customers may not want that combination or its cost may exceed an acceptable price.
Create a defensible distinction — Differentiation can arise from features, service, reliability, design, convenience or brand meaning. It provides advantage only if customers value it sufficiently and rivals cannot easily neutralise it. A technically unique feature may add cost without adding perceived value, so connect the distinction to a target need.
Calculate added value carefully — In the stated simple business model, added value is selling price less the cost of bought-in materials and components. A fictional café selling a prepared product for £5 with £1.40 of bought-in inputs creates £3.60 of added value before other costs. That is not £3.60 profit because wages, rent, marketing and other expenses still need covering.
Link positioning to capabilities — A premium promise requires consistent quality and service; a low-price promise needs an appropriate cost structure and volume. Align design, operations, staffing and promotion so the offered experience matches the position. An advertising slogan cannot indefinitely compensate for delivery that contradicts it.
Demand and its determinants
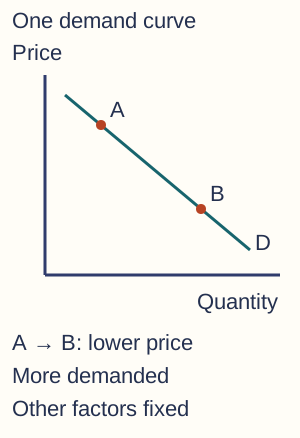
Distinguish movement and shift — A change in the product's own price causes movement along a given demand curve, other relevant conditions held constant. Changes in other determinants can shift the curve, changing quantity demanded at each price. Label price vertically and quantity horizontally, and state which condition changed before moving a curve.Movement A to B along one illustrative demand curve: a lower own price raises quantity demanded, other determinants fixed. No measured scale is implied.
Explain linked goods and income — A substitute competes as an alternative, so a rise in its price can increase demand for this product. A complement is used with another product, so a rise in the complement's price can reduce demand here. For a normal good, demand rises as income rises, other factors unchanged. For an inferior good, demand falls as income rises because customers switch to alternatives. Inferior describes this income relationship, not poor quality; the classification can vary between customers and income ranges.
Use contextual demand factors — Fashion, brand promotion, demographic change, seasons and external events can alter demand. Explain a chain from the factor to customer willingness and ability to purchase, then to the firm's sales opportunity. A stronger desire without purchasing power need not produce the same effective demand increase.
Supply and its determinants
Explain supply movements and shifts — Supply represents quantities sellers are willing and able to offer at different prices under stated conditions. An own-price change moves along a supply curve; changes in production conditions shift it. Distinguish quantity supplied from the stock currently held in a warehouse.
Connect costs and technology to supply — Higher input costs can reduce the quantity firms profitably offer at each price, shifting supply left. Productivity-enhancing technology can lower unit costs and support a rightward shift, although installation and training can create short-term disruption. Evaluate the time horizon and whether the technology works at the firm's scale.
Interpret taxes, subsidies and shocks — An indirect tax can raise costs of supplying a product, while a relevant subsidy can lower effective costs. Weather, disruption or geopolitical events can also alter availability. Do not assume the entire cost change is automatically passed to customers: the resulting price depends on market demand and supply responsiveness.
Market equilibrium and price adjustment
Explain equilibrium — At equilibrium, quantity demanded equals quantity supplied at the prevailing price in the model. Below that price, excess demand can create upward price pressure; above it, excess supply can create downward pressure. Equilibrium means plans are compatible, not that the allocation is ethically ideal or permanently unchanged.
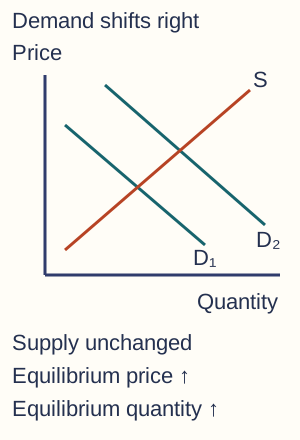
Trace one curve change at a time — If demand rises with supply unchanged, the standard upward-sloping-supply model predicts higher equilibrium price and quantity. If supply falls with demand unchanged, equilibrium price rises while quantity falls. Draw and label original and new curves and equilibria, and distinguish a shift causing change from movement along the other curve in response.An illustrative rightward demand shift with unchanged upward-sloping supply raises equilibrium price and quantity. The two intersections show the outcomes; curves have no measured numerical scale.
Evaluate simultaneous changes — If demand and supply both rise, quantity typically rises in the standard model, but the price effect depends on relative changes and slopes. Avoid an unconditional price prediction when the diagram or evidence leaves magnitudes unspecified. Adjustment can take time where capacity, contracts or information constrain response.
Price elasticity of demand
Calculate price elasticity — PED is percentage change in quantity demanded divided by percentage change in price, using a consistent stated percentage-change convention. If price rises by 5% and demand falls by 15%, PED = −3. Demand is price elastic because the magnitude exceeds one. The negative sign indicates the ordinary inverse relationship; elasticity is not the slope in pounds per item.
Interpret elasticity categories — A magnitude above one is elastic, below one is inelastic and equal to one is unit elastic under the stated measure. Perfectly inelastic demand has a PED of zero: quantity demanded does not respond to price in the model. Perfectly elastic demand is a limiting model where buyers accept a given price but demand falls to zero if the firm charges above it. These are limiting models rather than usual real-market descriptions. A demand curve's visual steepness alone is not a reliable elasticity comparison when axes or measurement units differ.
Explain elasticity determinants — Close substitutes, a large share of a customer's budget, a purchase customers can postpone or do without (discretionary spending) and time to adjust can make demand more responsive. Necessity, habit, strong differentiation or limited alternatives can reduce responsiveness in context. Brand loyalty may affect elasticity but does not guarantee customers accept unlimited price rises.
Connect PED to revenue — For a small price increase with elastic demand, the proportionate quantity fall tends to exceed the price rise, reducing total revenue; with inelastic demand, revenue tends to rise. Check actual P × Q figures for a finite change rather than treating a local estimate as exact over any price interval. Revenue change is not profit change because costs and margins also matter.
Work a pricing comparison — At £20 and 1000 sales, revenue is £20000. At £22 and 850 sales, revenue is £18700: a £1300 reduction. Using original-value percentage changes gives quantity change −15% and price change +10%, so PED = −1.5 over this stated calculation. Evaluate contribution, capacity, customer retention and competitors before recommending the price change solely from revenue.
Income elasticity of demand
Calculate and interpret YED — YED is percentage change in quantity demanded divided by percentage change in income. If income rises 4% and demand rises 6%, YED = 1.5 in the stated model. Positive values describe normal goods; negative values describe inferior goods, meaning customers shift away as income rises, not that the product is necessarily defective.
Distinguish income responsiveness — A positive value below one indicates proportionately less responsive demand, often associated with necessities in context, while above one indicates greater responsiveness often associated with discretionary spending. Classifications can differ by income range and market. Do not describe a product as an immutable luxury for every customer at every income.
Use income forecasts in decisions — A firm selling highly income-elastic products may face greater sales swings when incomes change, affecting capacity, stock and cash planning. A business serving more income-inelastic needs may have steadier demand but still face competition and cost changes. Apply forecast assumptions and segment evidence rather than treating YED as a guarantee of future sales.
Product design and the design mix
Balance function, appearance and cost — The design mix balances what a product does, how it looks or feels and its cost implications. A durable repairable design can increase initial cost but reduce later replacement or service costs. The appropriate balance depends on target needs, intended position and feasible production rather than one universally optimal design.
Respond to resource and ethical concerns — Reducing material use, designing for reuse, repair or recycling and choosing responsible sources can support customer trust and reduce some environmental burdens. Evaluate whole-life effects and evidence: lightweight packaging that increases product damage may not reduce overall resource use. Ethical claims need verifiable practice rather than a decorative label.
Apply the mix to services — A service's function includes reliable outcomes, while aesthetics can include the environment and interface and cost includes staff time or infrastructure. Improving one element may affect another, such as faster handling reducing personalised attention. Use the actual service process rather than assuming design applies only to manufactured objects.
Branding and promotion
Distinguish brand identity and promotion — A brand combines recognisable identifiers with perceptions and associations about an offering. Promotion communicates and stimulates interest through suitable methods, but repeated product and service experience shapes whether the promise is believed. A logo alone does not establish loyalty or a price premium.
Compare promotion methods — Advertising can reach broad audiences, sales promotion can create immediate incentives, public relations can build awareness through coverage and personal selling supports interaction. Direct and digital methods can target defined groups, while sponsorship links a brand to an activity or organisation. Choose using audience, message, budget, measurability and the purchase process rather than automatically selecting the largest audience.
Compare branding approaches — A corporate brand links offerings to one organisational identity, while individual product brands can target different positions and reduce some spillover between products. An umbrella strategy can spread recognition but a failure can affect the wider range. The appropriate approach depends on portfolio coherence, investment and reputational risk.
Explain branding benefits with conditions — Strong favourable associations can support repeat purchasing, differentiation, added value and lower price sensitivity. These benefits require ongoing delivery and can be damaged by quality failures or conflicting behaviour. Premium pricing may improve margin only if the extra willingness to pay exceeds the costs of building and maintaining the promise.
Evaluate social and emotional promotion — Social media and viral sharing can spread messages rapidly, but reach, interpretation and reputational consequences are not fully controllable. Emotional branding connects to identity or feelings and needs credible fit with the offer. Measure meaningful outcomes such as incremental profitable sales or retention rather than treating views or followers as equivalent to profit.
Pricing strategies and online comparison
Use cost-plus pricing accurately — Cost-plus pricing adds a stated mark-up to unit cost. With unit cost £40 and a 25% mark-up on cost, price is £50. The £10 difference is a 20% margin on the £50 selling price, so mark-up and margin are not interchangeable. An allocated unit cost can change with output, while customers and rivals may not accept the calculated price.
Compare skimming and penetration — Skimming starts with a relatively high price to capture willingness to pay among suitable early buyers, often where differentiation and entry barriers support it. Penetration uses a low initial price to attract volume or share, potentially requiring financial capacity and a route to later returns. Neither strategy guarantees success; low prices can signal poor quality or start rivalry, while high prices can restrict adoption.
Compare competitive and psychological pricing — Competitive pricing takes rival prices as an important reference but still needs the firm's cost and positioning evidence. Psychological pricing uses how customers perceive price points or reference values; its effectiveness varies by market. Matching a rival below one's sustainable cost can damage cash flow even if sales rise.
Interpret predatory pricing cautiously — Predatory pricing refers to deliberately very low pricing intended to weaken or exclude rivals, rather than every ordinary discount. Distinguish the strategic concept from a legal judgment requiring the applicable rules and evidence. An aggressive low-price strategy can create losses and invite scrutiny; the notes do not claim one simple price threshold establishes unlawful conduct.
Choose a coherent price strategy — Consider differentiation, brand, elasticity, product stage, cost coverage, competitors and objectives together. Online comparison can make price differences more visible, but delivery, guarantees, switching costs and service can still matter. A recommendation should explain the likely customer and competitor responses and the conditions under which it might fail.
Distribution channels and service models
Compare direct and intermediary routes — Selling directly can improve customer information and retain a larger share of the selling price but requires acquisition, fulfilment and service capabilities. Retailers, wholesalers or agents can add reach, expertise and convenience while taking margin and reducing some control. Count the functions performed rather than assuming fewer intermediaries always means lower total cost.
Evaluate online distribution — Online channels can widen access and availability, while logistics, returns, platform fees and digital competition affect profitability. A physical and online combination can support customer choice but needs coordination of stock, pricing and service. Online availability does not eliminate the physical delivery of a manufactured product.
Explain product-to-service changes — A subscription, rental or maintenance-based model can replace a one-off sale with continuing access and revenue, but changes ownership, customer commitment and service obligations. Evaluate revenue over the customer relationship, churn (the rate at which customers cancel or leave), financing of assets and operational demands. Recurring revenue is not automatically recurring profit if ongoing costs and cancellations are high.
Product portfolios and marketing strategy
Interpret the product life cycle — Development, introduction, growth, maturity and decline provide a model of sales development over time. Cash flow and profit need not follow the sales curve exactly because development, promotion and competition change costs. Stages are not fixed-duration laws, and recognising the current stage can be uncertain.
Evaluate extension strategies — A modified feature, new use, different segment or renewed promotion can support sales beyond an expected decline. Compare development or campaign cost, cannibalisation (new sales replacing sales of the firm's existing products) and the credibility of continued demand. Extending an obsolete product may use resources better invested in a replacement, so the decision depends on expected returns and strategic fit.
Use the Boston matrix — The matrix compares market growth with relative market share, producing the categories stars, cash cows, question marks and dogs in the model. Relative share compares the firm's share with the largest relevant competitor, not the firm's share percentage alone. Categories suggest funding and investment questions but do not replace product-specific profit, synergy or market evidence.Portfolio categories use market growth vertically and relative market share horizontally, with high share at the left. Relative share compares the firm with its largest relevant competitor; categories do not determine investment by themselves.
Evaluate portfolio balance — A cash-generating established product may help fund a promising growing one, but cash transfers depend on real margins and investment needs. A low-share product can still serve a valuable niche or support another offering. Do not automatically close every dog or assume every star already generates a cash surplus.
Adapt strategy to customer and market type — Mass-market strategy may emphasise reach and scale, while niche strategy can emphasise specific needs. Business-to-business purchasing often involves derived demand (demand for inputs arising from demand for the final product), technical requirements and several decision makers, while consumer purchases may use different channels and motives. These are tendencies requiring context, not a rule that business buyers ignore brand or consumers ignore specifications.
Develop loyalty economically — Reliable quality, service, relevant communication, switching benefits or a well-designed loyalty scheme can improve retention. Assess the customer's expected revenue less the variable costs of serving them over the relationship (lifetime contribution), alongside programme costs rather than only repeat-purchase counts. A discount can retain customers while reducing margin, and personalisation requires suitable data practices and customer trust.
Staffing approaches and employment relationships
View employees as assets and costs — Wages and training are expenses, but skills, knowledge, service and innovation can create value. A narrow short-term cost-cutting approach may reduce capability or commitment, while investment without a clear need can also waste resources. Relate staffing decisions to productivity, quality, flexibility and the business's objectives.
Evaluate workforce flexibility — Part-time or temporary contracts, flexible hours, home working, multi-skilling and outsourcing can help match demand or access expertise. Trade-offs include coordination, continuity, training, commitment and control. A flexible arrangement benefits performance only if the tasks, technology, supervision and employee needs fit it.
Distinguish dismissal and redundancy conceptually — Dismissal ends an individual's employment, while redundancy concerns a reduced requirement for the role or work in the stated business context. The terms have legal implications governed by applicable rules and circumstances, so this distinction is a business-study concept rather than a complete employment-law procedure. Consider capability loss, morale and financial effects when evaluating staffing reductions.
Compare individual and collective approaches — Individual arrangements can address particular roles, while collective bargaining involves representatives negotiating shared employment matters. Cooperation can improve information and commitment, while conflict can disrupt operations and trust. Evaluate the parties' interests, bargaining power and longer-term relationship rather than assuming either approach always minimises cost.
Recruitment, selection and training
Plan recruitment around the actual role — Identify the work required, specify relevant responsibilities and selection criteria and choose a method reaching suitable applicants. Internal recruitment can use known capability and support progression, while external recruitment can widen skills and perspectives. Neither route guarantees the best candidate; criteria, evidence and fair assessment remain important.
Evaluate selection and its costs — Applications, interviews, tests and work-related evidence can assess different aspects of suitability. Advertising, management time, assessment, vacancy cover and unsuccessful appointments create costs. Compare predictive relevance and accessibility of the method rather than selecting on an attractive but unrelated characteristic.
Compare training methods — Induction introduces the organisation and role; on-the-job training uses actual work with supervision; off-the-job training provides more separated learning. Workplace relevance, trainer quality, disruption, consistency and external expertise affect value. Training is not successful merely because attendance occurred: assess changed performance and retention of skills.
Evaluate training investment — Training can improve quality, productivity, adaptability and morale but costs money and time and trained employees may leave. Complement it with work design, equipment and opportunities to apply the learning. A training programme cannot alone solve a demand shortage or an incentive system rewarding the wrong behaviour.
Organisational design and delegation
Read a hierarchy — Hierarchy describes levels of authority, the chain of command traces reporting links and span of control counts direct reports. A manager with five immediate subordinates has a span of five even if those subordinates oversee many more people. Distinguish the organisational chart from informal influence and communication.
Compare tall and flat structures — Tall structures have more layers, potentially supporting narrower spans and progression but adding cost and communication steps. Flat structures reduce layers and can speed contact, while wider spans may overload managers if staff need close support. Effects depend on task complexity, capability and information systems rather than chart shape alone.
Distinguish centralisation and decentralisation — Centralisation concentrates decision authority, supporting consistency and coordination; decentralisation delegates more decisions closer to relevant operations or customers. Local knowledge and speed can improve, but control and consistency may become harder. A business can centralise major investment while decentralising customer-service decisions rather than choosing one arrangement for every issue.
Explain matrix structures — A matrix can combine functional expertise with project or product responsibilities, enabling cross-functional work and flexible resource use. For example, a designer may report to a design manager for professional standards and a project manager for a launch deadline. This dual reporting can create conflicting priorities and uncertainty about who is responsible for decisions. Clear roles and coordination are needed; a matrix is not simply any chart containing more than one department.
Evaluate authority and motivation together — Delegating suitable authority can develop skills and responsibility, but needs resources, clear limits and accountability. Removing layers without redesigning decisions can transfer workload rather than create genuine empowerment. Connect structure to communication, speed, staff motivation, service and cost using the actual context.
Motivation theories and incentives
Link motivation to outcomes cautiously — Motivation concerns willingness to direct effort towards goals and can affect attendance, persistence, service or innovation. Performance also depends on ability, tools, work processes and demand. A motivated employee cannot necessarily overcome faulty equipment or an unachievable target, so diagnosis should precede an incentive change.
Explain Taylor's scientific-management model — Taylor's approach emphasises analysing tasks, standardising efficient methods, selecting and training workers and using financial incentives linked to output. It can support measurable repetitive work but may neglect autonomy, task meaning or quality that is difficult to count. Present it as a management model with assumptions, not a universal fact that pay is everyone's only motive.
Explain Mayo's human-relations contribution — The human-relations approach emphasises social relationships, group membership, communication and managerial attention in understanding work behaviour. It suggests that organisation and interpersonal experience can matter alongside pay. Historical evidence and interpretation have limitations, so a friendly atmosphere alone should not be claimed to guarantee higher productivity in every setting.
Use Maslow's hierarchy critically — Maslow's model groups needs from basic physiological and safety concerns through social belonging and esteem (feeling respected and valued) to self-actualisation (developing and using one's potential). It can prompt managers to consider varied needs, but people do not necessarily follow one rigid universal sequence. Apply the model as a diagnostic perspective and check employee evidence rather than assigning all staff to one level from job title alone.
Use Herzberg's two-factor distinction — Herzberg distinguishes hygiene conditions, such as pay, supervision and working conditions, whose inadequacy can create dissatisfaction, from motivators associated with the work itself, such as achievement, responsibility and recognition. Improving poor conditions may remove dissatisfaction without creating sustained engagement on its own. The distinction is a theory to evaluate in context, not evidence that pay never matters.
Compare financial incentives — Piecework links pay to output units, commission to sales, bonuses to specified achievement, profit sharing to collective results and performance-related pay to defined assessments. Match the measure to desired behaviour and consider control over outcomes. A sales reward can encourage unsuitable selling or neglect of service if quality and long-term value are ignored.
Compare nonfinancial job changes — Job enlargement adds tasks at a similar level, rotation moves people between tasks and enrichment adds meaningful responsibility or challenge. Teamwork, consultation, delegation and empowerment can improve involvement if genuine and supported. More work without authority, recognition or capacity is not necessarily enrichment and can reduce motivation.
Evaluate flexible working and consultation — Flexibility can support work-life fit and recruitment, while consultation can improve information and acceptance. Benefits depend on the role, coordination and whether employees have real influence or usable options. Compare observed retention, absence, quality and productivity, acknowledging that several influences can change them simultaneously.
Leadership and management
Distinguish leadership from management — Management includes planning, organising and controlling resources, while leadership concerns direction, influence and commitment. One person can perform both roles. An inspiring vision without operational coordination may fail, and reliable administration without direction may struggle when change is needed.
Evaluate autocratic leadership — An autocratic leader makes decisions with limited subordinate participation. This can support rapid consistent action in an urgent situation or tightly specified work, but can suppress information and commitment. Speed is valuable only if the decision uses adequate expertise and staff can implement it effectively.
Compare democratic and paternalistic leadership — Democratic leadership involves consultation or participation in decisions, potentially improving information and acceptance but requiring time. Paternalistic leadership makes decisions while emphasising perceived employee welfare, which can build loyalty or feel restrictive if preferences are assumed. Explain who actually holds decision authority rather than equating every friendly leader with democracy.
Evaluate laissez-faire leadership — Laissez-faire leadership gives substantial freedom, potentially benefiting skilled self-directed teams but risking unclear priorities and coordination. Appropriate autonomy still needs agreed objectives and resources. Absence of support or accountability is not automatically effective empowerment.
Choose a situational style — Urgency, risk, employee expertise, organisational culture and the nature of change influence a suitable approach. A leader may use more direction in a crisis and more participation in designing an improvement. Evaluate likely effects on decision quality and execution rather than declaring one style permanently best for every organisation.
Entrepreneurship and intrapreneurship
Explain entrepreneurial coordination — An entrepreneur identifies an opportunity, assembles resources and takes responsibility for creating and developing a business under uncertain conditions. Work includes testing demand, arranging finance, choosing operations and adapting to evidence. An initial idea becomes a viable business only if customers, delivery and financial sustainability fit together.
Distinguish intrapreneurship — An intrapreneur develops innovations within an established organisation, potentially using its resources while facing its procedures and priorities. Support, incentives and permission to experiment can enable useful ideas. Internal innovation does not require every employee to leave and establish a separate legal business.
Evaluate barriers and uncertainty — Limited finance, skills, networks, time, confidence, market access or restrictive commitments can hinder entry. Training, partnership or staged testing may reduce some barriers but cannot eliminate all uncertainty. Evaluate a proposed remedy against the actual constraint rather than assuming motivation alone compensates for every resource gap.
Entrepreneurial motives and characteristics
Compare financial motives — Profit maximisation seeks the highest feasible profit under the stated conditions, while profit satisficing accepts a sufficient level alongside other goals. Income security, independence and lifestyle can influence what sufficient means. A business earning a positive profit is not thereby proven to be maximising it.
Compare nonfinancial motives — Ethical aims, a social mission, autonomy or a workable home-based pattern can motivate enterprise. These goals still need an economically viable model if the organisation is to continue. A social purpose does not automatically mean no sales, no surplus or no need to manage cash.
Evaluate skills without stereotyping — Resilience, initiative, communication, judgement, creativity and organisation can help, while technical and financial knowledge can be learned or complemented by a team. No fixed personality profile guarantees success. Use evidence about capabilities and support rather than claiming every successful founder shares one background or temperament.
Business objectives and trade-offs
Relate objectives to circumstances — Survival can dominate a new or cash-constrained firm's decisions, while growth, profit, sales, market share, efficiency, satisfaction or social outcomes may guide other stages. Objectives can coexist and change. A rise in sales does not prove success if the priority was profitable growth and losses widened.
Make objectives measurable and coherent — Specify the outcome, measure and time horizon so decisions and progress can be evaluated. Increasing share may require low prices that conflict with short-term margin, while better employee conditions can raise costs but support retention. Explain the trade-off and the context deciding its importance rather than listing goals without priorities.
Distinguish sales and profit maximisation — Revenue equals price multiplied by quantity, while profit deducts relevant costs. A lower price could maximise sales revenue yet reduce profit if the extra volume adds insufficient contribution. Interpret the stated objective and actual cost structure before recommending the largest possible sales number.
Business forms and growth to a public company
Compare sole trading and partnership — A sole trader owns and operates the business as an individual, while a partnership combines owners under the relevant arrangement. Simpler control and shared skills can be benefits, while personal liability, continuity and decision conflict need consideration. Legal details vary with form and jurisdiction; use the ordinary course model without presenting it as complete formation advice.
Explain private limited-company ownership — A private limited company has a separate legal identity and shares held privately under the applicable framework. Limited liability generally limits shareholder exposure to their investment or unpaid share obligations, but personal guarantees and misconduct can create separate risks. Incorporation adds administration and does not guarantee funding, profit or freedom from all personal responsibility.
Evaluate franchising — A franchisee uses a franchisor's established business format and brand under an agreement, usually paying fees and accepting restrictions. Recognition and operating support can reduce some startup uncertainty, while fees, dependence and limited autonomy are costs. The franchisor's brand reputation and enforcement of consistent standards affect both parties.
Distinguish social, lifestyle and online models — A social enterprise prioritises a social purpose within its business model; a lifestyle enterprise supports an owner's preferred way of working; an online business uses digital channels for significant activity. These categories concern purpose or method and can overlap with legal ownership forms. Being online does not itself confer limited liability.
Explain flotation and public share ownership — A business growing to a public limited-company structure may seek a stock-market flotation: offering shares to public investors through a stock exchange for the first time. Equity investors provide funds in exchange for an ownership stake. Potential benefits include funding and share liquidity, balanced against issue costs, disclosure, scrutiny and possible dilution of control: issuing new shares can reduce an existing owner's percentage of the shares and voting rights. Public limited does not mean owned by the government or that its shares are automatically listed on every exchange.
Choose a form in context — Consider finance, scale, liability, control, continuity, administrative capacity and the founder's purpose. A form suitable at startup may be reconsidered as investment needs and ownership change. Do not equate the cheapest setup with the lowest total risk or the largest legal form with the most suitable organisation.
Opportunity cost and moving into leadership
Explain opportunity cost — Opportunity cost is the value of the next best alternative forgone when choosing an option, not the sum of all rejected alternatives. If a founder uses limited time to develop one product, the relevant forgone benefit may be the best alternative project. Include time and capacity as scarce resources rather than treating only cash spending as a cost of choice.
Evaluate choices through conditions — Compare likely benefits, direct costs, opportunity costs, risk and reversibility against the objective. A staged trial can preserve flexibility while sacrificing some speed or scale advantage. State the assumptions most likely to change the recommendation instead of ending with an unsupported claim that either option could work.
Explain the founder-to-leader transition — As the organisation grows, the founder may need to delegate, recruit expertise, build systems and communicate direction beyond direct personal supervision. Attachment to an original idea or control can obstruct this transition. Professional management can add capability while creating tensions over autonomy, culture and the founder's changing role.
Integrate people and marketing decisions — A premium service strategy may require recruitment, training and discretion, while a standardised high-volume offer needs reliable processes and an appropriate cost base. Recommend a coherent combination of customer position, price, distribution, structure and incentives. Contextual evaluation should connect the functions rather than treating marketing and people as unrelated lists.
Test yourself
50 questions · Random sets of 10. These quick checks support revision; practise longer explanations and justified judgements too.
 Mr Kidman's Classroom