Multinational activity — A multinational corporation owns or controls productive operations in more than one country. Exporting alone does not establish such an operation. Different subsidiaries, suppliers, workers and customers can have different interests, so the corporation's global result and one locality's outcome need not coincide. Define the particular operation and relevant alternative before judging the effect of its presence.
Direct and indirect employment — A new operation can employ local workers directly and create supplier or service demand indirectly. Some jobs may replace existing activity, depend on imported inputs or draw staff from other employers. Gross jobs announced are not the same as net additional sustained employment. Compare wages, hours, skills, security and location as well as headcount, and distinguish planned from realised outcomes.
Pay and working conditions — A multinational may offer higher pay, training or safer conditions than local alternatives, or use weak bargaining power and enforcement to keep costs low. Compare relevant local opportunities, productivity, living costs and protections rather than assuming a foreign firm is always better or worse. Higher pay does not excuse unsafe work, discrimination or coercion. Workers within the same operation can experience different conditions.
Local suppliers and rivals — Orders, supplier development and knowledge exchange can support local firms, while a large entrant can also outcompete them or demand difficult terms. Local procurement depends on capability, quality, scale and reliability; it is not guaranteed by physical proximity. Crowding out and supplier dependence can offset some gains. Assess genuine additional demand and the capacity to upgrade rather than counting all purchases as a net benefit.
Community and infrastructure — An operation can contribute to infrastructure, tax-funded services and community demand, but also strain housing, roads, water and public capacity. Access matters: a private facility may not serve the wider population. Compare benefits and costs against a feasible alternative and identify who pays. Community contributions do not automatically compensate every affected resident for disruption or environmental harm.
Environmental effects — Production, transport, resource extraction, emissions and waste can impose local and wider costs not fully reflected in prices. Technology and management can reduce impacts, but a relocation can merely move damage across borders rather than eliminate it. Evaluate measured effects, baselines, enforcement and supply-chain stages. An efficiency improvement per unit can coexist with higher total emissions if output rises enough.
Growth and productive capacity — FDI can add capital, technology, management and market access, potentially raising real output and productivity. Acquiring an existing plant is not identical to immediately adding new capacity, and headline spending includes resources with alternative uses. Evaluate spillovers, domestic capability and the time horizon. Nominal sales or profit growth alone does not demonstrate higher real national output or broad development.
External-account effects — Initial investment can bring a financial inflow, while imported machinery and inputs can increase goods imports. Later exports may improve trade, while repatriated investment income affects primary income. These occur in different balance-of-payments accounts and periods. A foreign-owned plant's domestic production belongs in domestic output, but the income ultimately accruing to non-resident owners is a separate national-income issue.
Technology, skills and business culture — Training, demonstration, supplier contact and worker mobility can transmit knowledge. Actual spillovers depend on skills, institutions, access and whether technology is shared or protected. An operation isolated from local suppliers may generate limited learning. Working practices can improve quality or incentives while also creating cultural tensions; assess the mechanism and evidence rather than assuming every imported practice is superior.
Consumers and competition — An entrant can bring new products, lower costs, wider choice or improved service, while dominance, lock-in or withdrawal of rivals can weaken later competition. Initial low prices do not prove lasting consumer gains. Evaluate quality, reliability, access and market power over time. Consumers may also be workers or taxpayers, so separate effects before forming an overall judgement.
Tax receipts and public support — Employment and profitable activity can generate receipts, but allowances, incentives, losses, compliance and public service costs affect the net fiscal result. Corporation tax is not generally calculated by applying a tax rate to revenue. A promised investment does not guarantee a specific tax payment. Compare additional receipts with infrastructure, grants and other costs over a consistent horizon and accounting basis.
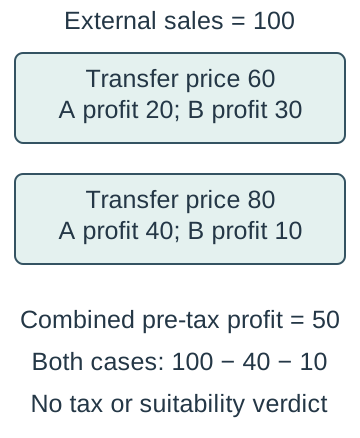
Transfer pricing — Transfer pricing sets prices for transactions between associated enterprises, such as a component sold from one subsidiary to another. Such transactions are normal and not inherently illegal. Prices affect where reported costs and profits appear; inappropriate manipulation can shift taxable profits. The OECD arm's-length principle compares conditions with those between independent enterprises in comparable circumstances, though unique assets and transactions make valuation difficult. OECD 2022 transfer-pricing guidance and arm's-length principle.
Original transfer-price illustration — Suppose a fictional group sells a product externally for 100, with genuine production cost 40 in country A and distribution cost 10 in B. A transfer price of 60 records profit 20 in A and 30 in B; a transfer price of 80 records 40 in A and 10 in B. Combined pre-tax profit remains 50 in this simplified example. The illustration shows allocation, not advice to manipulate prices or evidence that either figure is an acceptable arm's-length value.Original group example with external revenue 100, production cost 40 and distribution cost 10. Changing the internal transfer price changes the two subsidiaries' reported profit allocation but not combined pre-tax profit 50 in this simplified model. This neither determines an arm's-length price nor recommends manipulation.
Ethics, stakeholders and control of multinationals
Stakeholder conflict — Owners, managers, workers, consumers, suppliers, communities and governments can prefer different prices, pay, investment and environmental outcomes. Some interests align, such as safer work reducing disruption, while others involve real trade-offs. Identify power, affected groups and the time horizon rather than merely listing stakeholders. A profitable decision can still impose unpriced costs on others.
Labour standards and exploitation — Economic evaluation should consider safety, pay, hours, bargaining, freedom and security throughout the supply chain. Very low bargaining power or coercion can enable exploitation; a low nominal wage alone does not describe all working conditions or local purchasing power. Compare credible alternatives without using poverty as an excuse for abuse. Audit quality, worker voice and effective remedies matter alongside formal codes.
Child labour and supply chains — Harmful child labour can damage education, health and future capability. It is not synonymous with every age-appropriate task under safe conditions. A firm needs to identify risk beyond its immediate supplier, support credible monitoring and consider how remediation affects children and households. Abruptly removing orders without a realistic alternative can move the problem elsewhere; this is a reason to design effective remedies, not to accept harmful work.
Environmental responsibility — Waste handling, emissions and resource use create impacts across production and disposal. Compare prevention, cleaner processes, monitoring and remediation, including costs that markets may omit. A voluntary promise needs measurable boundaries and evidence rather than vague claims. Reducing one emission or outsourcing a polluting stage does not necessarily reduce the operation's overall environmental burden.
Marketing ethics — Misleading product labels, concealed risks or inappropriate promotion can distort informed choice and harm consumers. Claims about health, origin, sustainability or performance need evidence relevant to the actual product and audience. Legal compliance and ethical judgement are related but not identical. Short-run sales gains from misleading promotion can create longer-term consumer harm, reputational damage and corrective costs.
Political influence and bargaining — Large investors may influence policy through jobs, expertise, lobbying or the possibility of relocation. Governments also control access, procurement, infrastructure and enforcement. Neither side has unlimited power; alternatives, institutions, coordination and public scrutiny matter. Distinguish legitimate participation from unsupported allegations of improper conduct and examine whose interests a policy represents.
Legal control and enforcement — Competition, tax, employment, consumer and environmental rules can constrain conduct under their relevant jurisdictions. Enforcement requires information, resources, authority and remedies; multinational structures and cross-border activity can complicate it. The existence of a rule is not proof of compliance or effectiveness. Compare credible implementation with the costs of poor design and regulatory uncertainty.
Pressure groups and consumer action — Campaigns, investigation, consumer choices and investor pressure can change incentives and reveal information. Their effectiveness depends on evidence, reach, available substitutes and firms' sensitivity to reputation or revenue. A loud campaign is not automatically representative or accurate. Consider whether the response changes the underlying practice or merely its presentation.
Social media and information — Digital communication can rapidly expose conditions and coordinate campaigns, while false or incomplete information can also spread. Evaluate provenance (where a claim came from), corroboration (support from other evidence) and context before using a claim as evidence. Online attention does not necessarily translate into sustained sales or policy changes. Compare the speed of exposure with the capacity to investigate and remedy the actual problem.
Self-regulation — Codes, certification, reporting and internal controls can improve practice and respond more quickly than legislation in some settings. Conflicts of interest, selective disclosure, weak sanctions or poor verification can limit them. Independent auditing helps only if its scope, access and incentives are suitable. Compare self-regulation, enforceable rules and complementary worker or community participation rather than assuming one instrument solves every problem.
Global labour markets, wages and migration
Global labour-market links — Trade, investment, migration, technology and remote working connect labour markets across countries. Firms can access more potential workers or relocate some activities, while many tasks remain locally delivered or require particular qualifications. The global labour force is not one perfectly mobile, homogeneous market. Skills, language, institutions, legal access and infrastructure shape the actual degree of competition.
Structural employment change — Changing demand and technology alter the mix of occupations and sectors. Some jobs disappear, others expand, and workers face different opportunities to retrain or relocate. Growing total employment does not mean every displaced worker benefits. Separate changes in headcount, hours, participation, productivity and job quality when interpreting an international comparison.
Derived demand for labour — Firms demand labour because it contributes to output that can be sold. Product demand, productivity, output price, technology and the cost of other inputs affect this derived demand. A stronger product market can increase labour demand, but automation or capacity constraints can alter the response. Distinguish a demand shift from a movement along a curve caused by the wage itself.
Labour supply — Labour supply depends on pay, working conditions, preferences, skills, participation, migration and alternatives. The number of qualified people willing and able to work can differ from the whole population. A higher wage can attract workers to a particular occupation or location, with responsiveness depending on training time and mobility. Do not assume every labour-supply curve has the same shape in every range.
Competitive wage model — A simple labour-market model uses a downward demand curve and upward supply curve to determine an equilibrium wage and employment. It assumes relevant competition, information and adjustment; actual bargaining, discrimination, employer power and institutions can change outcomes. Label wage per time unit and labour input consistently. The diagram is an analytical benchmark, not proof that every observed wage is fair or efficient.
Skills and productivity — Education and training can raise relevant capabilities, productivity and access to better work. Outcomes depend on quality, application, vacancies and complementary capital; a qualification alone does not guarantee a job or a fixed wage premium. Some skills are transferable while others are specific to a firm or occupation. Compare private and wider benefits with time, cost and opportunity cost.
Global competition and recession — Competition from foreign production or workers can reduce demand for some domestic tasks while increasing demand in exporting, complementary or new activities. A recession can lower derived demand across several markets simultaneously. Wage contracts, hours and labour hoarding affect adjustment. Avoid treating all workers as perfect substitutes or attributing every wage change to globalisation alone.
Trade unions — Trade unions can negotiate pay, conditions, training and voice, potentially countering employer power and improving information. Their wage and employment effects depend on bargaining coverage, productivity, product demand and the employer's alternatives. Industrial action or inflexible agreements can impose costs, but bargaining can also support cooperation and retention. Compare the actual institutional setting rather than assuming one universal outcome.
Professional bodies — Professional bodies may support qualifications, standards, training and public confidence. Entry requirements can protect quality where consumers cannot assess it, but unnecessary restrictions can reduce labour supply and competition. Distinguish genuine competence needs from protection of existing members. Evaluate effects on workers, consumers and employers with evidence about quality and access.
Skill shortages and competitiveness — A shortage of suitable workers at prevailing conditions can raise recruitment costs, delay output and constrain investment. Training, retention, migration, pay and technology offer different responses with different lags. A reported shortage can reflect unattractive conditions or location rather than an absolute absence of people. Assess the job requirements and realistic alternatives before judging a policy.
Minimum wage in the competitive model — A binding minimum wage above the competitive equilibrium creates a gap between labour supplied and demanded in the simple model, other influences unchanged. It can raise the pay of retained covered workers while reducing labour demanded or hours. A floor below equilibrium is non-binding in that model. The prediction depends on assumptions and is not a complete empirical conclusion for all labour markets.Original competitive benchmark with labour demand w=20−0.2L and supply w=0.2L. Unconstrained equilibrium is wage 10 and labour 50. At binding floor 14, labour demanded is 30 and supplied 70, leaving an excess-supply gap 40. Wage units and labour period are illustrative; employer power, compliance and other responses require separate analysis.
Employer power and wage floors — Where an employer has wage-setting power, a suitably set minimum can raise both pay and employment relative to the low-wage monopsony outcome. Excessively high levels can still reduce employment or viability. Market structure, turnover, productivity, prices and profit margins affect the response. Use competitive and employer-power models to identify conditions rather than declaring that every wage floor always destroys or always creates jobs.
Coverage, compliance and informality — Minimum-wage effects depend on who is legally covered, actual compliance, enforcement and spillovers to other wages. Some workers can be outside coverage or in informal arrangements; a statutory increase does not guarantee every low-paid worker receives it. Developed and developing economies differ internally as well as between categories. Evaluate real pay, hours, jobs, prices and household income with appropriate evidence. ILO guidance on monitoring wage-floor coverage, compliance and wider outcomes.
Migration within an economy — Workers can move from rural to urban areas or between regions in response to jobs, pay, services and personal circumstances. Migration changes labour supply and local demand, with housing, transport and family constraints affecting mobility. Origin areas can lose skills while receiving remittances or reduced pressure on scarce jobs. Destination benefits and pressures depend on capacity and the skills match.
International migration — Cross-border migration can fill shortages, support production and entrepreneurship and change demand for services. Origin economies may gain remittances and knowledge links but lose scarce skills; destination groups experience different complementary or competitive effects. Wages, employment and fiscal outcomes depend on selection, age, skills, institutions and time. Do not infer an aggregate effect from one occupation or assume migrants do not consume or pay taxes.
Inequality and incentives in labour markets — Pay differences can reward scarce skills, responsibility or effort and encourage training, but also reflect inherited advantage, discrimination, bargaining power or limited opportunity. High inequality can weaken access to education and health, reducing productive potential. Equality of opportunity and equality of outcomes are distinct. Evaluate the source, scale and effects of differences rather than treating every unequal wage as either necessary or unjustified.
Poverty, inequality and their measurement
Absolute poverty — Absolute poverty concerns inability to meet a specified basic-needs or real-resource threshold. The line, household unit, price basis and date must be stated. It is not defined as simply being below the income of the richest group. Monetary measures give important evidence but can miss public services, insecurity, health and other dimensions of deprivation.
Relative poverty — Relative poverty measures resources against a specified standard in the society, often a proportion of median equivalised household income. It captures exclusion from prevailing living conditions rather than a fixed worldwide subsistence basket. A household's income can rise while its relative position worsens if the median rises faster. Relative and absolute measures answer different questions and can move differently.
National measures and household comparison — National poverty indicators can use income or consumption, before or after specified housing costs, with differing thresholds. Equivalisation adjusts for household size and composition to improve comparisons, but its scale is an assumption. Check whether income is disposable, the line is relative or held in real terms, and the data period. Do not compare two rates as equivalent when their definitions differ.
International poverty line — The World Bank's June 2025 update sets the international extreme-poverty line at 3.00 international dollars per person per day using 2021 purchasing power parities, replacing 2.15 on the 2017 PPP basis. These are purchasing-power comparisons, not a daily US-dollar cash exchange-rate conversion. A changed line and data vintage can revise estimated poverty without an equal sudden change in actual living conditions. World Bank 5 June 2025 poverty-line update and PPP explanation.
Headcount and poverty gap — A headcount ratio reports the proportion below the stated line; it does not show how far below it people are. A poverty-gap measure captures shortfalls relative to that line under its definition. If two households move closer to the line but remain below it, the headcount may be unchanged despite reduced shortfalls. Track both depth and incidence when assessing a policy.
Income and wealth — Income is a flow received over a period; wealth is a stock of assets less liabilities at a date. Earnings are one income source, while transfers and investment income can also matter. A household can have low current income and valuable housing, or a high income and substantial debt. Distribution measures must state whether they concern income, consumption or net wealth.
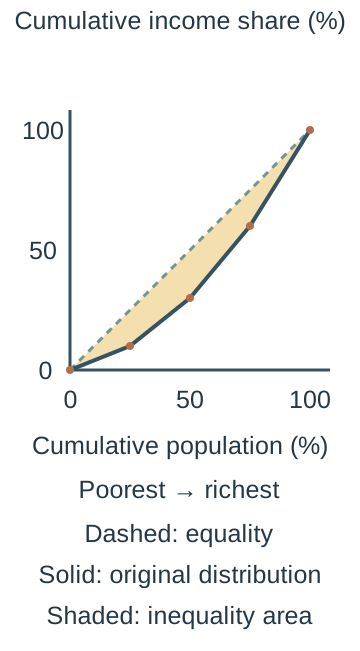
Lorenz curve — A Lorenz curve plots cumulative population ordered from poorest to richest on the horizontal axis against their cumulative share of the measured income or wealth on the vertical axis. The 45-degree line represents equality. For conventional non-negative incomes the Lorenz curve lies on or below that line; greater bowing generally indicates more inequality when curves do not cross. Define the population and resource measure before interpreting it.Original non-negative distribution: cumulative population 0/25/50/75/100% has cumulative income 0/10/30/60/100%. The solid piecewise-linear Lorenz curve is below dashed equality; shaded area is the difference, not the area under the curve. Axes use cumulative percentages; population is ordered poorest to richest. Not measured country data.
Gini coefficient — For the conventional Lorenz framework, the Gini is the area between equality and the Lorenz curve divided by the total area below the equality line. It is commonly expressed from 0 to 1 or scaled to 0–100; higher values indicate greater inequality. The scale must be stated. Negative incomes or wealth require special care because familiar bounds and curve interpretations need not hold unchanged.
Original Lorenz calculation — For an original non-negative distribution, cumulative income shares at population shares 0%, 25%, 50%, 75% and 100% are 0%, 10%, 30%, 60% and 100%. Convert percentages to proportions first: 25% is 0.25 and 10% is 0.10. The first trapezoid has area 0.25 × (0 + 0.10) ÷ 2 = 0.0125. With straight segments, all four trapezoid areas under the curve are 0.0125, 0.05, 0.1125 and 0.20 in unit-square coordinates, totalling 0.375. Gini = (0.5 − 0.375)/0.5 = 0.25, or 25 on the 0–100 scale. This is a teaching distribution, not country data.For the preceding original distribution, trapezoid areas total 0.375 below the Lorenz curve. The equality triangle is 0.5, so the gap 0.125 divided by 0.5 gives Gini 0.25, or 25 on the 0–100 scale. Both numerical scales describe the same distribution.
Limits of inequality summaries — Different distributions can have the same Gini, and crossing Lorenz curves complicate an unqualified ranking. The measure does not identify whether a change comes from the top, middle or bottom or whether absolute living standards improved. Survey coverage, top-income underreporting, household definitions and public services affect interpretation. Use group shares, poverty measures and contextual evidence alongside a single coefficient.
Poverty reduction, redistribution and incentives
Growth and poverty reduction — Sustained real growth can create jobs, raise incomes and expand resources for public services, but its distribution and environmental or social costs matter. Growth concentrated in enclaves may have limited effects on poor households. Consider employment intensity, prices, access to assets and public provision. A fall in an absolute headcount can coexist with higher relative inequality.
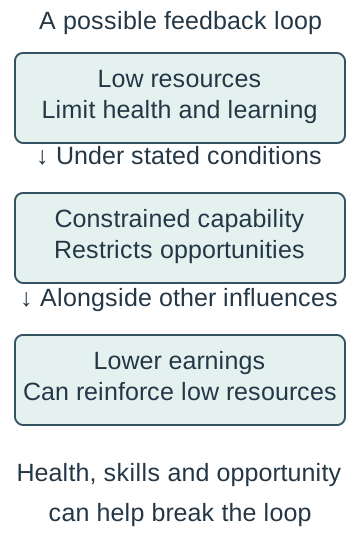
Low income and low productivity — Poor nutrition, ill health, weak education and lack of finance can limit productivity and earnings, reinforcing deprivation. Firms can face low purchasing power, weak demand and difficulty developing skills. This is a conditional feedback mechanism, not a claim that people in poverty lack effort or ability. Suitable health, education, infrastructure and opportunity can help break constraints, with quality and access determining results.A conditional schematic: low resources can constrain health and learning, which can restrict productive opportunities and earnings. Other influences matter and the loop is not inevitable. Suitable health, skills, infrastructure and opportunity can change the constraints; the model makes no claim about a person's effort or ability.
Distribution and the wider economy — Inequality can affect consumption patterns, savings, investment, social mobility, human capital and social stability. Incentive and financing benefits can coexist with exclusion and underinvestment among disadvantaged groups. The result depends on the source of inequality and institutions. Avoid inferring that either perfect equality or unlimited inequality automatically maximises growth or welfare.
International aid — Aid can finance emergency relief, health, infrastructure and capability when domestic resources are constrained. Design, local priorities, coordination, corruption risk, tied procurement and recurrent funding affect effectiveness. A grant differs from a loan, and a project announcement is not a demonstrated outcome. Evaluate additional benefits, dependency risks and feasible alternatives using evidence rather than treating all aid as one intervention.
Non-governmental organisations — NGOs can deliver services, advocate, build local capacity and respond flexibly, while accountability, coverage, coordination and continuity can be challenges. An NGO's independence or charitable purpose does not guarantee effective delivery. Compare local participation, outcomes and opportunity costs with other providers. Short-term relief and sustainable capability building address different needs and can complement one another.
Poverty-reduction policies — Education, health, sanitation, infrastructure, access to finance, employment opportunities and social protection can address different constraints. Target the diagnosed cause and affected group; a cash transfer may relieve immediate deprivation while training addresses a longer-term barrier. Implementation capacity, exclusion errors and funding matter. Compare a coherent package and the time horizon rather than assuming a single policy removes all poverty.
Progressive taxation and redistribution — A progressive tax takes a larger proportion of the relevant base as that base rises. A proportional tax has a constant average rate; a regressive burden takes a larger share from lower-resource groups under the stated incidence measure. Marginal rates apply to an additional slice, not automatically to all income. The overall system includes transfers and service benefits as well as tax receipts.
Cash and service provision — Transfers can increase recipients' spending power and choice, while health, education and other services can improve access and capability beyond market income. Means-testing can target funds but create administrative costs and withdrawal disincentives; universal provision has different coverage and financing trade-offs. Compare quality, take-up and effective access, not just the amount budgeted. A publicly funded service's value need not equal each recipient's cash income increase.
Poverty trap and effective withdrawal — A poverty trap can arise where extra earnings produce little extra disposable income because taxes rise and means-tested support is withdrawn. In an original example an extra 100 of earnings brings 20 extra tax and a 60 benefit reduction, leaving 20 extra disposable income. The effective marginal deduction rate is 80/100 × 100 = 80%. This combines the stated changes and is not a claim about an actual UK rate.Original hypothetical extra earnings 100 with tax 20 and benefit withdrawal 60 leaves 20 before any extra work costs. Combined deductions 80 divided by extra earnings 100 give 80%. This is not an actual UK tax or benefit rate and does not imply identical behavioural responses.
Incentives and policy design — High effective deductions can weaken incentives to increase earnings, but childcare, transport, health, job availability, preferences and uncertainty also affect choices. Smoother withdrawal, suitable services and better work opportunities can help at a fiscal or administrative cost. Do not assume everyone responds identically to a tax rate or that benefit reduction itself creates work. Evaluate net income after relevant work costs and the practical transition.
Income and wealth redistribution — Taxes, transfers, inheritance arrangements, asset access and public services can change distributions through different channels. Wealth can be illiquid and valuation can be difficult; income-based and asset-based measures do not affect the same households identically. Consider avoidance, compliance, mobility, investment and fairness criteria, with no presumption that one numerical equality measure captures every objective. Distinguish a policy's intended incidence from its realised burden.
Judging an anti-poverty package — Use clearly defined baseline poverty and distribution measures, specify the intervention and compare outcomes with a credible alternative. Assess incidence, depth, capability, jobs, incentives, funding, administration and environmental sustainability over relevant horizons. Identify uncertainty, implementation risks and who may be excluded. A defensible judgement explains mechanisms and evidence rather than assuming falling inequality alone proves that every poor household is better off.
Test yourself
50 questions · Random sets of 10. These quick checks support revision; practise longer explanations and justified judgements too.
 Mr Kidman's Classroom