Changing economic weight — Growth in economies including China and India changes the geography of demand, production and investment. Market potential depends on real incomes, population, distribution, infrastructure and the product, not national GDP alone. Large economies can contain low-income households and very different regional markets. Assess the relevant segment and date rather than treating a national average as a complete sales forecast.
Different development paths — Industrialisation, services, investment, skills, productivity and urbanisation can change output and employment structures. China and India have different institutions, sector mixes and demographic conditions; countries across Africa are also highly diverse. Do not substitute a continent for a single economy or assume that development requires an identical sequence. Identify country-specific constraints and opportunities using dated evidence.
Employment structure — Primary activities extract or grow resources, secondary activities transform products and tertiary activities provide services. A falling agricultural employment share can coexist with rising agricultural output if productivity increases or other sectors expand. Employment shares and GDP shares answer different questions. Informal work, unpaid activity and classification affect comparisons, so examine measurement as well as the apparent structural change.
Income and market segments — Rising real disposable incomes can increase demand, with the size and direction depending on income elasticity, distribution and changing preferences. A growing middle-income segment may support new products while many households remain price constrained. Demand for an inferior good can fall as income rises, other things equal. Do not classify all consumers or products from one country's average growth rate.
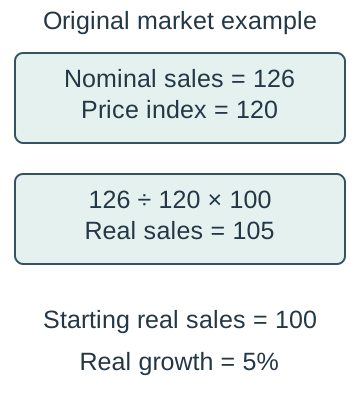
Nominal versus real market growth — A market's sales value can rise because prices rise, quantities rise or the product mix changes. In an original example nominal sales rise from 100 to 126 while the relevant price index rises from 100 to 120. The final real sales value at base prices is 126/120 × 100 = 105, a 5% real increase. The nominal rise of 26% is not a 26% volume increase.Original example: nominal sales 126 divided by price index 120 and multiplied by 100 gives real sales 105 on the stated base. Relative to original 100, real growth is 5%, while nominal growth is 26%.
Indices and growth factors — Rebasing a comparable real series makes proportional changes easier to compare: divide each observation by the chosen base and multiply by 100. An index moving from 150 to 165 rises by 10%, not 15%; the latter is an index-point difference. Successive growth rates compound. Two years of 10% growth raise a starting 100 to 121, a total 21% increase rather than 20%.
International trade as a growth channel — Access to larger markets can support specialisation, scale, competition, imported technology and investment. Imports can improve consumer choice and productive inputs as well as compete with domestic producers. The gains depend on institutions, skills, infrastructure and the distribution of adjustment costs. A positive association between trade and growth does not alone establish the direction or size of causation.
Foreign direct investment — FDI involves a lasting cross-border investment relationship with significant influence over an enterprise, rather than simply selling exports or buying a small tradable financial holding. It can establish a new operation or acquire an existing one. The international statistical convention commonly uses at least 10% of voting power as the influence threshold; operational control can require more. Distinguish a financial transaction, ownership and the productive outcomes that follow. OECD direct-investment definitions, fifth edition 2025.
Inward and outward investment — Inward FDI is received by the economy under discussion; outward FDI is investment by its residents abroad. One transaction is outward for its source and inward for its destination. A flow measures transactions during a period, while an FDI stock records the position at a date and can change through valuation as well as new investment. Do not compare a year's flow with a stock without explanation.
Benefits and limitations of FDI — Investment can add capital, employment, skills, technology and supplier demand, while acquisition does not automatically add new productive capacity immediately. Profits may be repatriated, local firms can face displacement and incentives can cost public funds. Evaluate additionality, linkages, working conditions, environmental effects and financing rather than treating the headline investment value as a net welfare gain.
Trade and investment together — Firms can export components within an international production network, invest near customers and import specialist equipment. Trade and FDI can complement each other or substitute for particular flows. A plant serving a local market can reduce finished-goods imports yet increase imported inputs. Trace the actual production and ownership arrangements before predicting the external-account effect.
Evidence for international opportunities — Use dated real-income, sector, population, employment and trade or investment evidence with clear units, definitions and sources. Compare a relevant time series and competitor conditions rather than selecting one favourable observation. National revisions, exchange-rate conversion, informal activity and uneven regional data limit precision. Distinguish a realised historical observation from a forecast or a firm's own illustrative scenario.
Trade agreements and protection
Bilateral and multilateral agreements — A bilateral agreement links two parties; a multilateral arrangement involves several under its specified rules. Agreements differ in goods, services, investment, standards and enforcement coverage. Signing an agreement does not instantly remove every cost or guarantee market demand. Check entry into force, origin rules (rules deciding where goods count as being made), exclusions and the relevant product before applying a general description.
Free-trade areas and customs unions — A free-trade area reduces internal barriers while members retain separate external trade policies, requiring origin rules to determine preferences. A customs union also uses a common external tariff. A single market goes further into movement of goods, services, people and capital under its rules. These forms are distinct; a member's currency or political arrangements cannot be inferred solely from the trade label.
Trade creation — Trade creation occurs when integration allows lower-cost partner production to replace higher-cost domestic production. Consumers and input users may gain from lower prices and resources can move towards more efficient uses. The size depends on demand, supply, adjustment and remaining barriers. Lower-cost production is an economic resource comparison, not merely a lower taxed selling price.
Trade diversion — Trade diversion occurs when preferences cause a higher-cost member supplier to replace a lower-cost non-member supplier. In an original simplified case an outside producer costs 8 and a member costs 9; an external tariff of 2 makes the outsider's buyer price 10, so purchases switch to the member at 9. Consumers can pay less than before while the source shifts to higher resource cost and tariff revenue is lost. Evaluate this alongside creation and dynamic gains.
EU and UK context — The EU combines a customs union with a single market under its institutional rules. The UK left the EU in 2020, with the transition ending that year; the subsequent Trade and Cooperation Agreement is a distinct relationship, not continued general UK membership of the EU single market or customs union. Preferential goods trade still has conditions and administrative costs. Northern Ireland has specific arrangements, so do not generalise every border rule to every UK transaction. European Commission explanation of the UK–EU agreement and origin conditions.
ASEAN as a comparative example — ASEAN illustrates regional cooperation and progressive trade integration among diverse Southeast Asian economies, with agreements and implementation differing by sector and member. It is not simply an EU-style single market with identical institutions or a common currency. Use the actual applicable arrangement and date. Firms must still consider standards, infrastructure, political conditions and consumer differences within the region. ASEAN explanation of its trade-in-goods framework.
NAFTA and its successor — The specification names NAFTA as a historical North American example. USMCA replaced it and entered into force on 1 July 2020, connecting the United States, Mexico and Canada under updated rules. Teach the general trade mechanisms and distinguish the older example from its successor. Neither label implies all goods move free of conditions or that current tariffs can be inferred from a 2014 specification example. USTR record of USMCA replacing NAFTA from 1 July 2020.
Why governments protect — Arguments for protection include infant-industry development, jobs, strategic capacity, revenue, balance-of-payments pressure and responses to unfair practices. Each requires a mechanism and evidence: shelter can also weaken incentives or protect an industry indefinitely. National security and distributional aims differ from a claim of maximum aggregate efficiency. Compare feasible alternatives and international retaliation rather than assuming every stated aim is achieved.
Tariffs — A tariff is a tax on imports. A specific tariff is an amount per unit; an ad valorem tariff is a percentage of a stated value. In a small-country model with a fixed world price, no other costs and full pass-through, a tariff raises the domestic price by the tax while leaving the world price unchanged. In actual markets exchange rates, margins and market power can change who bears the burden.
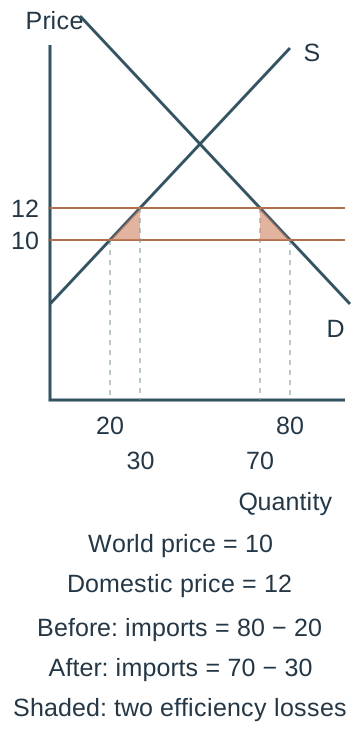
Tariff quantity example — In an original small-country model at world price 10, domestic supply is 20 and demand 80, so imports are 60 units. A tariff of 2 raises the domestic price to 12, where supply is 30 and demand 70; imports become 40. The tariff reduces imports through both increased domestic supply and reduced domestic demand. Label price and quantity axes, domestic supply/demand, both prices and all relevant quantities.Original small-country model with fixed world price 10, specific tariff 2 and full pass-through. At 10, supply 20/demand 80 imply imports 60; at 12, supply 30/demand 70 imply imports 40. Domestic supply is P=6+0.2Q and demand P=26−0.2Q. Shaded triangles show the production and consumption efficiency losses under this linear benchmark, not the entire consumer loss.
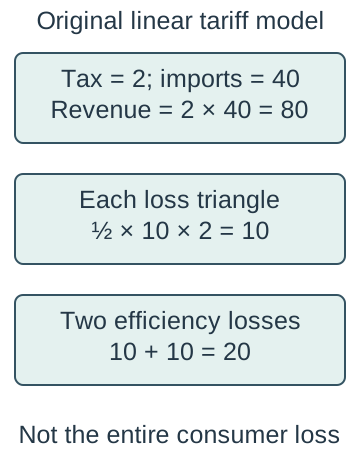
Tariff revenue and welfare — In that model tariff revenue is 2 × 40 = 80 currency units. Consumers lose from the higher price, domestic producers gain surplus (returns above their minimum willingness to supply), government gains revenue and two deadweight-loss triangles arise. Deadweight loss is the net benefit society loses from the resulting production and consumption changes, after transfers between consumers, producers and government are accounted for. With linear curves, the production and consumption losses are each one-half × 2 × 10 = 10, totalling 20. Imports do not become zero, and the original 60-unit import volume is not the post-tariff revenue base.Using the preceding original model, tariff revenue is 2×40=80; each shaded efficiency-loss triangle is ½×10×2=10 and total deadweight loss is 20. This calculation depends on the stated small-country linear model and excludes other possible policy aims or external effects.
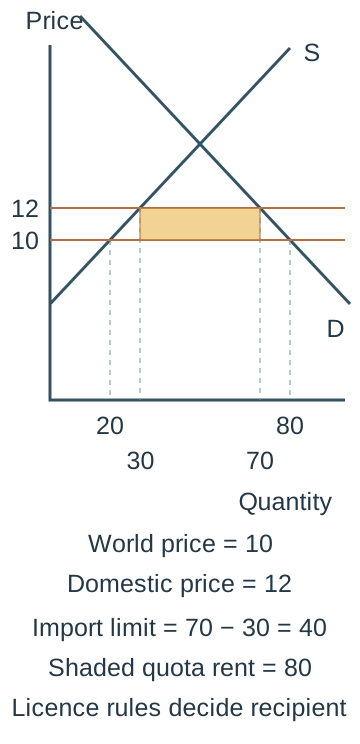
Import quotas — An import quota limits the permitted quantity of imports rather than taxing each unit. If binding, it can raise domestic prices by restricting supply; its price effect changes with demand and domestic production. A quota giving the same 40 imports can reproduce price 12 in the stated model, but quota rents, the extra returns arising from permission to sell scarce imports at the higher domestic price, total 80 and accrue to licence holders unless arrangements such as auctioning transfer them to government. A quota is not automatically equivalent to tariff revenue.The same domestic supply and demand model with an import quota fixed at 40. At price 12, domestic demand 70 minus supply 30 equals the quota. The shaded price-gap rectangle is quota rent (12−10)×40=80. It goes to licence holders unless allocation such as an auction transfers it; government does not automatically receive tariff revenue.
Subsidies and other barriers — A subsidy can lower a supported firm's effective cost or sustain output, while requiring public financing and potentially affecting rivals. Product standards, licensing, customs procedures and administrative delays can restrict trade, but some rules address genuine health, safety or environmental concerns. Identify purpose, proportionality and effects rather than calling all standards disguised protection. A domestic production subsidy has different consumer-price and financing effects from the tariff model.
Retaliation and supply chains — A protected producer can gain while firms using imported inputs face higher costs and exporters face retaliation. Internationally fragmented production makes national gains harder to infer from the location of a final assembly stage. Uncertainty can delay investment even before a barrier is applied. Evaluate consumer, worker, firm and government effects over time, including transition and the counterfactual policy.
International institutions, currencies and interdependence
World Trade Organization — The WTO provides a framework for negotiated trade rules, monitoring and dispute processes among members, with commitments and exceptions. It is not a world government that automatically abolishes every barrier or determines every national tariff. Negotiation, compliance and enforcement face practical constraints. Distinguish the institution's function from an assumption that all disputes are resolved instantly or every policy is identical. WTO account of its functions.
International Monetary Fund — The IMF supports international monetary cooperation and financial stability through surveillance, advice, lending and capacity development. Assistance can help a country facing external or financial difficulties, often with agreed policy conditions. It is distinct from a commercial lender to an individual firm. Evaluate the need, design, adjustment costs and alternatives rather than assuming lending always solves structural problems or always has the same conditions. IMF account of its role.
World Bank — The World Bank supports longer-term development through financing, knowledge and projects under its institutions and programmes. Infrastructure, education, health and institutional capacity can affect productive potential and poverty. Project quality, implementation, debt sustainability, environmental effects and local participation matter. Distinguish development finance from the IMF's macroeconomic-stability role without pretending their activities never overlap. World Bank account of its development role.
G20 and coordination — The G20 is a forum for international economic cooperation among major economies and regional bodies, rather than a trade agreement that grants every member tariff-free access. Coordination can address shared instability and spillovers, but members have different priorities and implementation remains political. Do not infer current membership details or binding legal powers from the label alone. Evaluate actual agreements and follow-through.
Exchange rates and external balance — Depreciation can improve export price competitiveness and restrain import volumes while increasing import costs. Contracts, elasticities, capacity, invoicing and initially unchanged volumes can delay or offset an improvement in the trade balance. It can also raise imported inflation. Assess the relevant goods and services and financing conditions, not a rule that any weaker currency immediately eliminates a current-account deficit.
Exchange rates and investment decisions — Currency movements change the home-currency cost of foreign assets and the value of future receipts, but do not alone determine FDI. Expected demand, risk, financing, input costs, repatriation and future exchange rates matter. A cheaper acquisition can still be a poor investment if earnings fall or institutions create problems. Distinguish an immediate conversion gain from a sustainable real return.
Currency unions and the euro — A common currency removes bilateral exchange-rate risk and conversion costs among participants and can improve price comparison. Members give up independent national monetary-policy and exchange-rate instruments, creating adjustment challenges when shocks differ. Fiscal institutions, labour mobility and financial links affect resilience. EU membership and euro participation are distinct, and adopting a common currency does not eliminate all credit or business risk.
International spillovers — A downturn in one economy can reduce another's export demand, commodity receipts, investment or credit access. Stronger foreign growth can create demand while raising competition for resources. The size and direction depend on exposure and policy responses. Trace trade, finance and confidence separately and consider diversification rather than assuming interdependence always amplifies or always reduces risk.
International expansion and location decisions
Push factors — A saturated home market, intense rivalry, weak domestic growth or constraints can push a firm to consider foreign expansion. A push is a motive to search, not proof that an overseas project is superior. Diagnose the domestic problem: poor product quality may follow a firm abroad. Compare improving the home operation, partnerships and other uses of scarce funds.
Pull factors — Growing foreign demand, favourable infrastructure, access to inputs, talent, trade preferences or investment incentives can attract a firm. Potential depends on actual customers, costs and risks rather than a country's reputation. A large population with low purchasing power may not support a particular premium product. Match evidence to the firm's segment, capabilities and planned method of entry.
Scale and risk spreading — International sales can spread fixed costs and expose a firm to several markets, potentially reducing dependence on one economy. Correlated global shocks, management complexity, currency exposure and shared suppliers can limit diversification. Economies of scale require suitable output and coordination; extra countries can add diseconomies. Compare marginal benefits and costs rather than equating geographic breadth with resilience.
Product life cycle and capacity — A product mature in one market may be newly attractive elsewhere because incomes, tastes, competition and infrastructure differ. Expansion can use spare capacity and extend returns from existing development, but demand must be researched and adaptation may be needed. Do not assume every country repeats the same life-cycle path or that surplus domestic stock automatically finds foreign buyers. Timing, service and distribution affect viability.
Offshoring and outsourcing — Offshoring relocates an activity to another country; outsourcing contracts an activity to a separate supplier. A firm can offshore to its own foreign subsidiary without outsourcing, or outsource domestically without offshoring. Using an independent overseas supplier involves both. Distinguish location from organisational ownership before analysing cost, control, knowledge, quality and resilience consequences.
Entry methods — Exporting, licensing, franchising, joint ventures and owned foreign operations involve different commitments and control. Exporting can test demand with lower fixed investment but still requires distribution and compliance. Licensing allows another firm to use specified intellectual property for payment; franchising gives rights to use a brand and business format under agreed conditions. A joint venture shares an agreed project or enterprise between partners. A partner may add local knowledge while creating profit-sharing, quality or intellectual-property risks. Select a method according to the activity and evidence, not a claim that full ownership is always best.
Selecting a national market — Assess real and disposable income, its distribution, target segments, demand trends, competition and price responsiveness. Consider exchange rates, inflation, political stability, legal reliability and practical costs of doing business. A composite ranking is an imperfect summary and can conceal the firm's actual constraint. Use a transparent weighted comparison and test whether reasonable weight changes reverse the choice.
Infrastructure and market access — Transport, power, broadband, payment systems and distribution affect the cost and reliability of serving buyers. A large theoretical market can remain inaccessible if delivery, storage or after-sales support are weak. Urban and rural conditions can differ widely. Identify the specific bottleneck and potential investment or partnership rather than treating national infrastructure as uniform.
Political and regulatory exposure — Changes in tax, trade rules, permits, ownership limits or capital movement can affect costs and the ability to operate or repatriate earnings. Political stability is relevant but does not guarantee an unchanging policy environment. Evaluate credible scenarios and enforceable arrangements with country-specific evidence. These economic comparisons do not replace the need to follow actual applicable rules.
Choosing a production location — Production sites require labour with suitable skills and productivity, resources, suppliers, infrastructure and reliable access to customers. Compare total delivered cost, quality and timing, not wage rates alone. Proximity to inputs can trade off against distance to markets. Currency, environmental, managerial and disruption exposures can overturn an apparently cheap site.
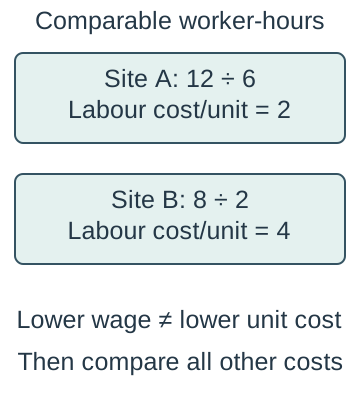
Labour cost and productivity comparison — In an original example site A pays 12 per worker-hour and produces 6 units per worker-hour, giving labour cost 2 per unit. Site B pays 8 but produces 2 units per hour, giving labour cost 4 per unit. The lower wage does not imply the lower unit labour cost. Then add quality, materials, transport, overheads and risk before comparing total relevant costs.Original comparison with consistent hourly units: site A pays 12 and produces 6, giving labour cost 2 per unit; site B pays 8 and produces 2, giving 4. Materials, defects, logistics, overheads and disruption must also enter a total delivered-cost comparison.
Incentives and expected return — Tax relief, grants or serviced land may attract investment but can be conditional, temporary or offset by other costs. Calculate expected costs and revenues over a consistent horizon and test demand, currency and delay scenarios. A one-off grant is not recurring operating profit. Consider clawback conditions, exit costs and the opportunity cost of public and private resources before claiming a net gain.
Global marketing and cultural differences
Global and local strategies — A global strategy coordinates products and marketing across markets to gain consistency and scale. Local adaptation tailors choices to particular consumers, institutions and conditions. Firms often combine standard platforms with adapted features, service or messages rather than choosing an absolute extreme. Judge which elements can be shared and which require change using research and cost evidence.
Glocalisation — Glocalisation combines a global approach or brand with adaptation to local conditions. A fictional food business might retain its production-quality system and visual identity while adapting recipes and pack sizes after research. Adaptation can improve fit but add development, sourcing and coordination costs. The label is useful only when the actual changes and reasons are identified.
Ethnocentric approach — An ethnocentric orientation treats home-country practices and assumptions as the main reference for overseas activity. It can simplify coordination and preserve tested features but risks misunderstanding foreign customers and institutions. It is a management orientation, not a judgement about the moral character of every employee. Evaluate its observable effect on decisions, evidence and performance.
Polycentric approach — A polycentric orientation recognises different national markets and allows substantial local adaptation or management discretion. Local knowledge can improve fit and responsiveness while duplication, inconsistent standards and coordination costs arise. National markets themselves contain diverse segments. Adaptation should be based on evidence rather than national stereotypes or the assumption that every local proposal is effective.
Geocentric approach — A geocentric orientation seeks an integrated worldwide perspective, selecting practices and resources for their usefulness across the organisation rather than automatically privileging home or host country. It can combine learning and scale with suitable adaptation, but requires capable coordination and information. It is not identical to selling exactly the same product everywhere. Compare the orientation with the firm's actual structure and resources.
Price and non-price competition — A firm can compete through price, quality, design, reliability, service, branding and availability. International pricing must consider incomes, elasticity, rivals, taxes, distribution and exchange rates. Brand recognition can support differentiation but does not guarantee trust or legal protection everywhere. A lower price that covers neither relevant cost nor the intended strategic aim is not automatically competitive success.
Mass and niche markets — A mass market targets broad demand; a niche serves a more narrowly defined group with particular needs. International reach can make a small local niche commercially viable across several countries, while research and service costs remain. A premium niche may have loyal buyers yet face small volumes or close substitutes. Define the segment rather than using niche as a synonym for expensive or profitable.
Culture, language and communication — Tastes, customs, social meanings, religion, language and communication channels can influence product acceptance and marketing. Meanings differ within as well as between countries, so test wording and imagery with relevant audiences. Literal translation can create unintended messages, while a translated slogan alone does not establish local fit. Avoid stereotypes and distinguish researched evidence from assumptions.
Research and the marketing mix — Review product features, price, promotion and distribution together for the target market. Combine secondary evidence with suitable primary research, test a feasible launch and monitor customer response rather than applying a home-market survey uncritically. Sampling, question wording and changing preferences limit certainty. Country-wide averages cannot replace a defined segment and a clear decision.
Evaluating expansion — Compare plausible entry and marketing options using expected demand, contribution, fixed costs, capabilities, timing and country risks. Include stakeholder, ethical and environmental effects as well as private return, with a realistic alternative use of funds. Test sensitivity to exchange rates, demand and disruption, and identify evidence that would change the decision. A qualified judgement follows the connected evidence rather than counting a list of advantages.
Test yourself
50 questions · Random sets of 10. These quick checks support revision; practise longer explanations and justified judgements too.
 Mr Kidman's Classroom