Mortality, morbidity and well-being — Mortality concerns deaths; morbidity concerns illness or impaired health; well-being includes broader physical, mental and social experience. A population can live longer while spending more years with ill health. Use several compatible indicators rather than assuming that low mortality proves every resident enjoys good health.
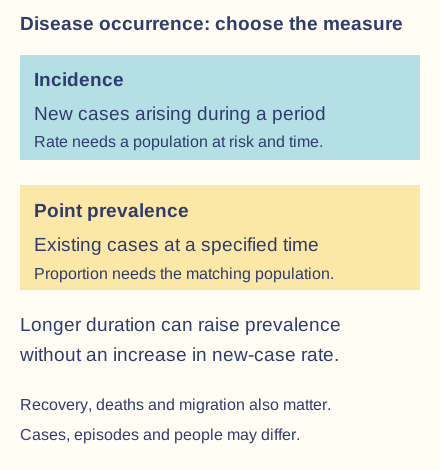
Incidence and prevalence — Incidence measures new cases over a defined period and population at risk; prevalence measures existing cases at a stated time or over an interval. Improved survival can increase prevalence without more new cases. Specify diagnosis, denominator, dates and whether repeated episodes are counted before comparing places.The diagram compares concepts, not measured health values. State case definition, denominator and observation period before comparing places.
Life and healthy life expectancy — Life expectancy estimates survival under stated mortality conditions; healthy life expectancy adds a defined measure of time in good health. These are population summaries rather than an individual's predicted lifespan. Age structure, measurement, uncertainty and social inequalities affect interpretation.
Epidemiological transition — The model describes changing patterns from a larger burden of infectious disease and early mortality toward chronic and non-communicable conditions as societies change. Real populations can face both burdens, outbreaks and uneven access simultaneously. It is not proof that infection disappears with development or that every non-communicable condition is caused only by individual lifestyle.
Climate, terrain and disease — Temperature, rainfall, humidity and drainage can alter vectors, water quality and exposure. Topography affects water accumulation and access to services, while housing, infrastructure and management mediate the relationship. Suitable physical conditions alone do not establish actual disease transmission or an identical risk for every resident.
Air quality pathways — Transport, energy, industry, dust, fires and indoor sources can affect exposure to gases and particles. Pollutant concentration, duration, individual susceptibility and time spent in different places influence effects. A legal annual-average objective, a health guideline and a short-term peak describe different things; compliance does not mean all health risk is zero.
Water quality pathways — Pathogens and chemical contamination can affect health through drinking, food preparation and other contact. Flooding, inadequate sanitation and unreliable supply can increase exposure, while treatment, monitoring and safe infrastructure reduce it. Dirty water is not the direct cause of every geographically associated illness; identify the actual transmission or exposure route.
Unequal exposure and access — Income, work, housing, education, discrimination and service availability shape both exposure and ability to prevent or manage illness. A polluted location can coincide with other disadvantage, complicating causal inference. Avoid blaming individuals for conditions beyond their control or treating national income as every household's capacity.
Malaria: vector, pattern and management
Specified communicable disease — Malaria is the school's selected biologically transmitted disease. Plasmodium parasites cause infection, most commonly transmitted through infected female Anopheles mosquitoes. A mosquito is a vector rather than the pathogen itself. Malaria is not normally spread by casual contact or simply by drinking dirty water, although water conditions can affect vector habitats.
Transmission cycle — An infected mosquito can transfer parasites to a person during feeding; parasites develop in the human host and can be taken up by another suitable mosquito. Transmission therefore requires connected host, parasite, vector and environmental conditions. Some other transmission routes exist, so the geographical model explains the main vector pathway rather than every exceptional case.
Temperature and moisture — Temperature influences mosquito survival, biting and parasite development, while rainfall and humidity influence habitat and survival. Too cool, too hot, too dry or destructive flooding can constrain parts of the cycle. The response is not a simple rule that each additional degree or millimetre always increases transmission everywhere.
Seasonal incidence — Where rainfall or temperature strongly varies, transmission can peak seasonally with lags after suitable conditions develop. Irrigation, stored water, drainage and perennial water can modify seasonal patterns. Annual totals obscure timing, and the month of peak rain need not be the month of peak recorded cases.
Global distribution and burden — Malaria occurs in several tropical/subtropical regions, with the WHO African Region carrying most of the global burden. WHO's December 2025 fact sheet estimates 282 million cases worldwide in 2024 and about 95% in that Region. The Region is a defined reporting unit rather than a statement that every African country or resident has identical risk.
Vulnerability and experience — Young children and pregnant people face particular risks, while immunity, mobility, nutrition and health-system access affect severity and outcomes. Illness can interrupt school, work and caring, increase household costs and reduce income. The resulting disadvantage can limit prevention and treatment, creating a reinforcing social-health pathway.
Housing, livelihoods and movement — Screens, building quality, sleeping arrangements, outdoor work and access to prevention affect mosquito contact. Displacement or movement can place people in unfamiliar transmission settings or disrupt care. A map of climate suitability alone misses these social and behavioural exposure differences.
Vector control — Insecticide-treated nets and suitable indoor residual spraying can reduce contact or vector survival under relevant local guidance. Effectiveness depends on coverage, use, vector behaviour, insecticide resistance and delivery. Distribution counts alone do not measure protection for every household or justify assuming all mosquitoes bite only when people are in bed.
Diagnosis and treatment systems — Timely accurate diagnosis and access to appropriate medicines reduce severe illness and help control transmission. Health-worker capacity, affordability, transport, reliable supplies and resistance matter. These are population-health management mechanisms, not a diagnosis, personal drug regimen or permission to substitute a geography resource for clinical care.
Vaccination and integrated prevention — WHO recommends malaria vaccines including RTS,S/AS01 and R21/Matrix-M for appropriate child populations in endemic settings, within wider prevention programmes. Vaccination is not a universal replacement for vector control, diagnosis and treatment. Implementation, access and local guidance matter more than assuming that vaccine availability alone ends transmission.
International action and limits — WHO develops guidance and supports monitoring; financing partners, national services and NGOs contribute supplies, programmes and community access. Coordination, sustained funding and locally effective delivery are essential. Count intended, delivered and used resources separately, and assess outcomes alongside resistance, conflict, climate and reporting changes.
Changing distribution and evidence — Climate change can alter seasonal and geographical suitability, while effective health systems can limit actual cases. Recorded increases can also reflect surveillance, population change or disrupted prevention. Compare compatible rates and exposure before attributing a trend solely to warming or interpreting zero reported cases as proof of no infection.
Asthma: non-communicable disease and environment
Specified non-communicable disease — Asthma is the school's selected non-communicable disease, involving variable airway narrowing and inflammation. It is not passed between people like an infection, although infections can trigger symptoms in someone with asthma. Separate developing the condition, triggering symptoms and the severity of outcomes.
Multiple influences — Family susceptibility, allergic conditions, early-life development, indoor/outdoor exposures, occupation and other factors are associated with risk. The exact mix differs among people and cannot usually be reduced to one pollutant or choice. An association across neighbourhoods does not establish the cause of an individual person's condition.
Global distribution and recording — Asthma affects children and adults worldwide. WHO's April 2026 fact sheet estimates 363 million people affected in 2023, with under-diagnosis and under-treatment important challenges in many lower-resource settings. Recorded prevalence reflects true burden and ascertainment, meaning how effectively cases are identified and recorded; a low diagnosis rate is not sufficient evidence of little underlying illness.
Outdoor exposure and weather — Traffic-related pollution, particles, smoke and pollen can worsen symptoms, while weather influences pollutant dispersion and seasonal allergen exposure. Effects differ by individual susceptibility and local conditions. Asthma is not caused only by urban traffic, and rural or apparently clean-looking places are not automatically free of relevant triggers.
Indoor and occupational environments — Damp, mould, dust mites, tobacco smoke, fumes and occupational exposures can contribute to risks or exacerbations. Ventilation, heating, maintenance, tenure and work conditions affect control over exposure. Advice that assumes everyone can immediately change home or job ignores structural constraints.
Health and livelihood effects — Poor control can impair sleep, concentration, attendance, work and participation and can lead to severe attacks and hospital care. Burden depends on severity, prevention and access rather than diagnosis alone. Compare lived experience and functional impact alongside mortality; low death counts do not mean negligible morbidity.
Healthcare and environmental management — Appropriate clinical diagnosis, inhaled treatment, supported self-management and monitoring can improve control, while housing and air-quality measures address exposure. Access, affordability, continuity and suitable information influence outcomes. These are population-level mechanisms; individual treatment decisions remain with relevant clinical guidance and professionals.
Prevention, equity and evaluation — Reducing harmful emissions and addressing damp or occupational risks can complement care, but benefits depend on delivery and actual exposure change. Compare admissions, symptoms, quality of life and inequalities with consistent denominators and periods. A new clinic or an emission policy is an output, not automatic evidence that every patient's condition improved.
Comparing malaria and asthma — Malaria's main pathway involves parasite-vector-host transmission; asthma involves non-communicable airway disease with multiple susceptibility and trigger factors. Both reflect environmental conditions, unequal access and interacting social consequences. Compare prevention mechanisms and evidence without assuming that one environmental measure or economic development removes all disease.
Lincoln: place, health and lived experience
Confirmed local area and boundaries — Lincoln is the school's selected place-and-health study. Use the City of Lincoln district when discussing its ONS district data, distinguishing the city, built-up area, surrounding neighbourhoods and wider Lincolnshire. County or health-service boundaries include different populations; their averages cannot be presented as exact city or ward outcomes.
Physical setting and everyday exposure — Lincoln's urban roads, housing, green space, slopes and water environment influence daily routes, activity, pollutant contact and access. The same distance can imply different practical access for someone with limited mobility or poor transport. Explain a plausible mechanism using place evidence rather than assuming the name of a neighbourhood determines health.
Socio-economic pathways — Income, employment conditions, housing costs/quality, education and service access can shape health and well-being. Differences within the city can be substantial even where one district average is used. Deprivation indices describe areas and relative disadvantage; they do not identify each resident's income, diagnosis or attitude.
Verified self-reported health evidence — ONS's Census 2021 account reports 41.1% of Lincoln residents describing health as very good and 5.1% as bad, using age-standardised proportions, which adjust for differences in population age structure to support fairer comparisons; very bad was 1.4%. These are perceived overall-health categories, not clinical diagnoses or crude age shares. Census Day occurred during the COVID-19 pandemic, which may have influenced responses.
Interpreting the comparison — In the same ONS age-standardised series, very good health was 40.6% in 2011 and 41.1% in 2021, an increase of 0.5 percentage points. A small aggregate change does not prove every neighbourhood or group improved, and it does not isolate one cause. Compare question wording, populations, uncertainty and other evidence.
Air-quality evidence and report dates — The council's June 2025 Annual Status Report presents 2024 monitoring. Its maximum monitored annual-mean nitrogen dioxide value was 33.1 µg/m³ at Site 3; the remaining Lincoln air-quality management area was revoked in April 2025. Monitoring year and administrative change answer different questions, so keep their dates separate when comparing the environmental setting.
Interpreting monitored air quality — A maximum at one site is not every resident's exposure, and an annual mean can hide short peaks and differences in travel or indoor time. The 2025 report's Broadgate annual-mean PM10 value for 2024 was 19.0 µg/m³, compared with 20.4 in 2023. Compliance or removal of a management designation does not prove zero health risk, no other pollutant, or no need for continued improvement.
Housing and health relationships — Heating, crowding, damp, ventilation, affordability and neighbourhood conditions can affect respiratory risk, stress and capacity to manage illness. Compare housing evidence with resident accounts and health measures rather than assuming all tenants or all older dwellings share identical conditions. A district correlation is not a diagnosis of individual residents or proof that one housing factor caused every outcome.
Access and local institutions — The Lincolnshire health-and-wellbeing strategy and Joint Strategic Needs Assessment (JSNA), an assessment of local health and care needs, support partnership decisions across local government, NHS and voluntary organisations. They provide a wider context for Lincoln, not a city-only health score. Service access involves cost, appointment availability, transport, language/digital access and trust as well as geographic distance.
Experience and attitudes — Interviews, consultation and other ethically collected accounts can reveal perceptions of safety, pollution, care and local belonging that official rates miss. Accounts need context and should include different groups rather than one assumed resident voice. No authentic school interview, quotation, participant attitude or candidate fieldwork result is invented here.
Comparing local evidence safely — Combine compatible district/small-area health measures, dated air monitoring, housing/transport evidence and published lived experience. Check area boundaries, age standardisation, deprivation components, population composition and time. Avoid circular reasoning: an index already including poor health cannot by itself independently prove that its correlation with health is caused by income.
Global environmental change and health evaluation
Thermal and nutritional pressures — Climate change can affect heat exposure, work, water, crops and food security, with different risks by age, housing and resources. Floods, drought and disrupted services can interact with existing illness. Explain actual pathways and adaptive capacity rather than forecasting the same burden for every location from one temperature change.
Ozone and ultraviolet exposure — Stratospheric ozone helps screen ultraviolet radiation; depletion can increase relevant exposure and risks such as skin cancer and cataracts. This is a distinct mechanism from greenhouse warming, although environmental policies and consequences can interact. The atmospheric ozone layer and harmful near-ground ozone are also different geographical/chemical contexts.
Agency, NGO and national roles — International bodies coordinate evidence, standards and financing, while national/local services and communities implement care, prevention and environmental action. NGOs can support particular access gaps but cannot substitute for every public-health function. Assess funding, continuity, accountability and inclusion rather than counting organisations as proof of effectiveness.
Worked rate comparison — In fictional places with comparable definitions, 200 new cases among 10,000 residents in one year equals 20 per 1,000; 300 among 30,000 equals 10 per 1,000. The second place has more cases but a lower rate. Different age structures, surveillance and repeated episodes can still limit inference about individual risk or management quality.
Evaluating health claims — Distinguish ecological correlation, plausible mechanism and evidence of causation; account for age, reporting, access and overlapping disadvantage. Use dates and denominators for global disease burden and Lincoln indicators. A strong judgement connects environment, society and experience while recognising uncertainty, agency and unequal opportunity to improve health.
Test yourself
50 questions · Random sets of 10. These quick checks support revision; practise longer explanations and justified judgements too.
 Mr Kidman's Classroom