A system has a chosen boundary — A geographical system is a set of interacting components studied within an explicit boundary. A drainage basin is the land area drained by a river and its tributaries. Its watershed is the boundary, usually higher ground, separating it from neighbouring basins. It is bounded at the surface by that watershed and its outlet, while the global water system includes oceans, land, ice and atmosphere. A transfer leaving one component can enter another without leaving the larger system, so classification depends on scale.
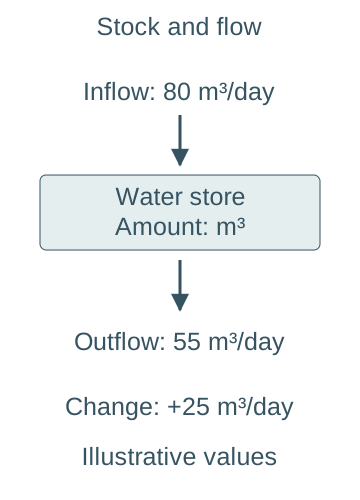
Stores are not flows — A store is an amount of water present at a time, measured in units such as cubic metres. A flow is a transfer over time, such as cubic metres per second or millimetres per day across a stated area. A large store can have a small transfer rate; a small atmospheric store can participate in rapid cycling. Stock means the amount stored; flux means the rate of transfer. Compare stock with stock and flux with flux, using compatible units.A store is an amount, while a flow has a time denominator. These invented rates give a net increase of 25 cubic metres per day; they do not specify the total amount already stored.
Open and approximately closed systems — A basin exchanges both water and energy across its boundary and is an open system. At the course's usual global timescales, Earth's water cycle is treated as approximately closed to matter while open to energy: solar energy enters and heat is radiated to space. This is a useful approximation, not a claim that individual water stores are fixed or that every physical exchange with space is exactly zero.
Energy moves the cycle — Solar energy supports evaporation and helps drive atmospheric circulation; gravity moves rain, runoff, groundwater and ice downhill. Evaporation absorbs latent heat while condensation releases it, linking phase changes to atmospheric energy. Water does not create new mass when it changes phase: the same material is redistributed among stores.
Dynamic equilibrium allows movement — A store in dynamic equilibrium can have continuing inflows and outflows with no sustained change in its amount because the rates balance. A whole cycle need not be motionless or have equal flow rates in every arrow. Seasonal fluctuations and short storms can temporarily move a basin away from an average balance without proving a permanent trend.
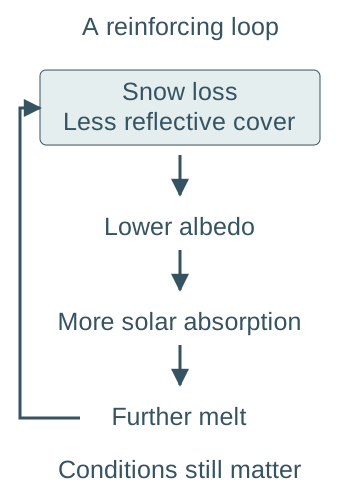
Feedback describes a response loop — A positive feedback amplifies an initial change, while a negative feedback opposes it. The labels describe direction, not whether the outcome is desirable. For example, a rise in a lake's level may increase outflow and limit further rise. As a contrasting positive feedback, loss of reflective snow can expose a darker surface, increasing absorbed solar energy and encouraging further melt where other conditions permit. Albedo is the proportion of incoming sunlight reflected by a surface. The loop is snow loss → lower albedo → greater absorption → further snow loss; its strength depends on season, cloud and the exposed surface. A claimed feedback must link back to the original variable; two one-way consequences are not yet a complete loop.Snow loss can lower surface albedo, increase absorbed solar energy and encourage further melt. The final change reinforces the starting snow loss. This conditional positive feedback does not imply a constant strength in all seasons or cloud conditions.
Major global water stores — The hydrosphere contains liquid water in oceans, lakes and rivers; the cryosphere includes glaciers, ice sheets, snow and frozen ground. Water also occurs in soils and aquifers within the near-surface lithosphere, in the atmosphere as vapour/cloud water, and in organisms. These labels can overlap by disciplinary convention, so avoid counting the same frozen groundwater twice when assembling a budget.
Relative sizes need a denominator — A widely used historical estimate presented by USGS puts about 96.5% of total water in oceans. Within freshwater, about 68.7% is in ice caps, glaciers and permanent snow and about 30.1% in fresh groundwater. These are different percentage bases. The USGS table credits a 1993 synthesis; use it as a rounded comparative estimate, not a newly measured 2026 census of every water molecule.
Freshwater availability is not total abundance — A large freshwater stock may be frozen, deep, distant, polluted or replenished slowly. Rivers and accessible lakes form a much smaller share of total storage than oceans, ice and groundwater but can supply important usable flows. Assess reliability, recharge and access as well as size; a high national average does not guarantee supply to every community.
Residence time is an estimate — A simple turnover estimate is store size divided by a compatible outflow rate. A store of 1200 m³ with average outflow 60 m³ per day has nominal residence time 20 days. Real water parcels have a distribution of ages and may follow fast and slow pathways, so the ratio is not the exact journey time of every parcel.
Atmospheric and cryospheric transfers
Evaporation depends on energy and moisture demand — Liquid water becomes vapour when molecules escape the surface, drawing on available energy. Net evaporation is affected by temperature, humidity, wind and exposed water, as well as whether moisture is available. Warm conditions alone do not ensure high actual evaporation if the surface is dry or the air is already very humid.
Transpiration and evapotranspiration — Plants take up soil water and lose vapour through leaves, particularly stomata, the small pores in leaf surfaces. Evapotranspiration combines this transpiration with evaporation from surfaces. Vegetation, growing season, soil moisture, energy and atmospheric demand all matter. Potential evapotranspiration describes demand under adequate moisture, whereas actual evapotranspiration can be lower when water is limiting.
Cooling rising air to saturation — An air parcel lifted to lower pressure expands and generally cools. Cooling can bring it to saturation, allowing condensation onto suitable particles and cloud development. Clouds consist of tiny liquid droplets and/or ice crystals rather than visible water vapour itself. Cooling is a mechanism, not proof that all lifted air will immediately produce surface rain.
From cloud particles to precipitation — Cloud droplets or ice particles must grow sufficiently for their fall to outweigh upward air motion, and they can change phase or evaporate during descent. Coalescence occurs when liquid droplets collide and join into larger drops. Ice crystals can also grow and join together, and may melt into rain as they fall. A cloud need not yield rain at the ground; the physical route depends on temperature structure and particle growth.
Convective uplift — Surface heating can make air buoyant, encouraging rising columns, expansion and cooling. With enough moisture and instability, deep cloud and intense showers can develop. Local short-duration rainfall can differ sharply across a basin, so one gauge may not represent the spatial pattern. Convection is not confined to the equator or to one hour of the day.
Orographic uplift — Air forced over upland relief can cool and enhance cloud and rainfall on an exposed slope. Descending air beyond the high ground may warm and dry, producing a relative rain shadow. The outcome depends on wind, moisture and atmospheric structure; relief can enhance frontal precipitation rather than acting as a completely separate weather system.
Frontal uplift — Where contrasting air masses meet, lower-density warmer air can be lifted over colder air, producing cloud and precipitation. Frontal systems may bring widespread sustained rainfall, with intensity varying through time and space. “Warm” and “cold” are relative descriptions of the air masses, not fixed absolute temperature thresholds.
Snow and ice delay transfers — Precipitation can be stored as snow and ice before melt releases liquid water. Accumulation includes snowfall and other gains, while ablation includes melting, sublimation and loss processes. A warm or rain-on-snow episode can increase runoff rapidly, but the basin response depends on snowpack, soil state and storage as well as air temperature.
Freezing, thawing and sublimation — Freezing stores liquid as ice and thawing remobilises it; sublimation transfers ice directly to vapour. Frozen soil can restrict infiltration and promote rapid surface runoff under some conditions. Seasonal snow may turn over quickly, whereas glacier ice can store water for much longer; “cryosphere” does not imply one universal residence time.
Drainage-basin stores and flow pathways
The basin as an open water system — Precipitation is a principal input; evapotranspiration and water leaving through the outlet are principal outputs. Groundwater can cross the surface watershed, and abstraction (taking water for use), transfers between basins or return flows after use may add further terms. Start with a clearly defined basin and time interval rather than assuming a surface boundary isolates all subsurface water.
Interception changes timing and partitioning — Leaves and branches temporarily store precipitation. Some intercepted water evaporates; throughfall passes through gaps or drips to the ground, while stemflow moves down plant stems. Canopy capacity and storm duration matter. Interception does not permanently remove every drop from the basin and may become less effective once the canopy is saturated.
Surface and depression storage — Puddles, hollows, wetlands and reservoirs temporarily hold water at the surface. Their empty storage capacity can delay runoff, but their effect changes as they fill. Water retained briefly may later infiltrate, evaporate or spill into channels. A storage intervention's existence does not establish how much unused capacity remained during a particular event.
Infiltration is entry into soil — Infiltration is the movement of water from the surface into the soil. Its capacity depends on structure, compaction, surface sealing, vegetation, moisture conditions and relevant freeze/thaw state. Percolation is subsequent downward movement through soil or rock. The two terms describe different stages and should not be swapped in a pathway explanation.Infiltration crosses the ground surface into soil; percolation is subsequent downward movement through soil or rock. The orange line marks the ground surface. The schematic separates process stages and is not a scale geological section.
Soil water is an active store — Soil pores hold water of differing mobility. Plants withdraw some; gravity drains some; remaining water can be held too tightly for ready plant uptake. Field capacity describes water remaining after substantial free drainage, while saturation fills the connected pore space. A soil can support limited plant water availability before it becomes physically empty of all moisture.
Throughflow and preferential paths — Water can move laterally through soil toward channels, especially along permeable layers above less permeable material. Root channels, cracks and pipes can provide faster preferential paths. Subsurface flow is not always slow; the pathway's connectivity and hydraulic conditions matter more than a blanket surface-versus-underground speed rule.
Groundwater and the water table — Below the water table, connected pore or fracture spaces are saturated. An aquifer stores and transmits groundwater; permeability requires connected pathways, while porosity is a measure of void space. A porous material need not transmit water rapidly if its pores are poorly connected or very small. Water tables rise or fall with recharge, discharge and abstraction.
Baseflow links stores to rivers — Groundwater discharge can sustain channel flow between storms. Its timing depends on aquifer properties, hydraulic gradients (differences in water pressure and elevation that drive flow) and connections to the river; some reaches instead lose water into the ground. The “baseflow” separated on a hydrograph is an analytical estimate, not a directly labelled pipe carrying all underground water.
Infiltration-excess overland flow — If rainfall intensity exceeds the local infiltration capacity, water can accumulate and flow over the surface even before the whole soil profile is saturated. Compacted or sealed surfaces can favour this pathway. Compare rates over the relevant time and area; a total daily rainfall depth alone does not specify the short intense burst driving the process.Infiltration-excess flow can arise when rainfall intensity exceeds local infiltration capacity before the profile is saturated. Saturation-excess flow occurs when further rain reaches saturated ground. Either mechanism may operate within one basin; the boxes are explanations, not quantitative thresholds.
Saturation-excess overland flow — When a soil is already saturated or becomes saturated near the surface, additional rainfall can generate surface runoff even at a modest intensity. Saturated source areas often expand during prolonged wet conditions. Distinguish this mechanism from rainfall exceeding infiltration capacity on an unsaturated surface.
Channel storage and routing — Water entering the drainage network is stored temporarily in channels and floodplains as it moves toward the outlet. Routing combines tributary inputs arriving at different times. Straightening or connecting drainage can speed transmission, but the downstream peak also depends on synchronisation of tributaries and available storage, not only the speed of one parcel.
Water balance, hydrographs and worked interpretation
A simplified mass balance — For a defined basin and interval without additional transfers, P = ET + Q + ΔS, where P is precipitation, ET is evapotranspiration, Q is water leaving through the outlet and ΔS is the change in storage. All terms must cover the same interval and use compatible water-equivalent depths or volumes. Positive ΔS means storage increased. Add imports, exports or cross-boundary groundwater where relevant; an unexplained residual may reflect measurement error or omitted pathways rather than creation or destruction of water.
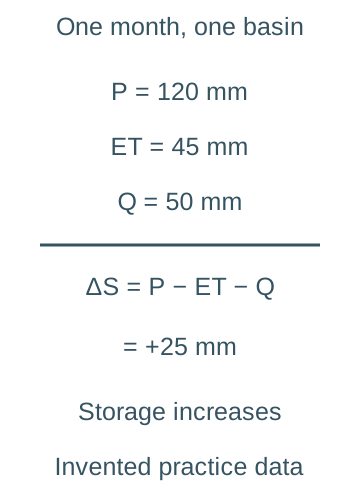
A worked storage change — For an explicitly invented monthly practice budget with P =120 mm, ET =45 mm and Q =50 mm, ΔS =25 mm. The inputs exceed the measured outputs, so stored water increases. If a question instead gives a storage loss of 10 mm, write ΔS =−10 mm; treating the magnitude as a positive gain reverses the inference.For this invented month, precipitation 120 mm minus evapotranspiration 45 mm and outlet runoff 50 mm leaves a positive storage change of 25 mm. All values refer to the same basin area and interval, with other net exchanges omitted by the stated simplified model.
Depth-to-volume conversion — A mean rainfall depth of 20 mm over a 2 km² practice basin represents 0.020 m ×2,000,000 m² =40,000 m³ of water. Use basin-average depth rather than one unrepresentative point measurement if estimating a real volume. Convert both depth and area before multiplying; mm×km² is not automatically m³ without its scale factors.
Discharge and runoff volume — Discharge Q is a rate, commonly m³s⁻¹. A constant practice discharge of 2m³s⁻¹ for one hour yields 2 × 3600 = 7200 m³ because one hour contains 3600 seconds; for a changing hydrograph, estimate volume from the area under Q against time, converting hours to seconds. A peak rate alone does not determine the event's total runoff volume.
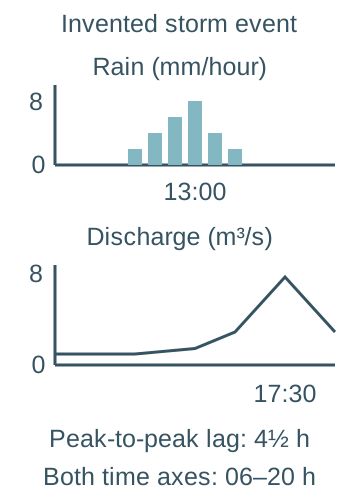
Reading a storm hydrograph — A storm hydrograph plots river discharge through time, often with rainfall shown separately. Identify the rising limb, peak discharge and recession limb, and state the units of both axes. In one common convention, lag time is the interval between peak rainfall intensity and peak discharge; another analysis may use the rainfall centroid, the time that balances the rainfall distribution on either side, so specify the definition used.The two invented event panels share a linear time coordinate from 06:00 to 20:00 but have separate labelled vertical scales. Rainfall intensity peaks at 13:00 and discharge peaks at 17:30, giving a peak-to-peak lag of 4.5 hours. Bar heights are illustrative hourly rates; the discharge curve joins selected practice values and is not observed field evidence.
A worked lag calculation — In an invented practice event, peak rainfall occurs at 13:00 and peak discharge at 17:30, giving peak-to-peak lag 4.5 hours. Time from the start of rain to peak flow is a different measure. The event is not a reported flood at a named catchment and should not be reused as actual field evidence.
What a flashy response means — A comparatively steep rise, short lag and high peak can indicate efficient rapid pathways for that event relative to basin size and forcing. Compare storm duration/intensity, antecedent wetness and gauge location before attributing the difference solely to urbanisation. A broad recession can reflect continued drainage from stores, not continuing rain alone.
Separating quickflow and baseflow — A simplified analysis may draw an estimated baseflow line beneath the event response, treating the additional area as quickflow. Separation methods differ and quickflow can include rapid subsurface contributions. Do not equate all water above the line with exclusively overland flow or present a chosen dividing line as an observed physical boundary.
Seasonal water budgets — During wetter or lower-demand months, precipitation can replenish soil and groundwater; during high-demand periods, evapotranspiration can draw down stores. A soil moisture deficit means stored water is below a chosen reference such as field capacity. A seasonal surplus can contribute to runoff or recharge, with timing controlled by actual pathways and capacity.
Residence and response times are different — A flood peak may propagate through channels faster than a particular parcel travels from a hillslope to the gauge, while old stored water may be displaced into a storm response. A short hydrograph lag does not establish that all peak water fell as rain a few hours earlier. Use tracer or other evidence before making water-age claims.
Natural variation, human change and local evidence
Antecedent wetness and storm properties — Antecedent wetness means how wet the basin was before the event. Prolonged earlier rain can reduce unused soil/storage capacity and expand saturated areas; a short intense storm may instead exceed infiltration capacity. Storm movement, spatial coverage, duration and rainfall form all affect routing. Similar total rainfall can therefore produce different hydrographs in the same basin.
Geology, relief and basin form — Permeable connected rock can support infiltration and delayed drainage; less permeable substrates may promote rapid pathways. Steep slopes, drainage density and basin shape can alter delivery times and tributary synchronisation. These are interacting tendencies, not a rule that one characteristic determines every peak independently of weather and land management.
Urban surfaces and drainage — Sealed surfaces reduce direct infiltration and connected drains can deliver water rapidly to channels. Urban storage, parks, permeable pavements and drainage design can modify that response. Identify the effective connected impermeable area rather than treating every building or every urban hectare as identical. Downstream effects need catchment evidence and an event context.
Farming and soil management — Machinery and livestock can compact soil, while bare ground or downslope tracks can connect rapid runoff paths. Vegetation cover, root structure, tillage choices and buffer strips can alter infiltration, roughness and routing. Effects depend on soil type, season and implementation; “all farming increases flooding” is too general to be an explanation.
Vegetation change and trade-offs — Removing vegetation can reduce interception and transpiration and disturb soils, affecting water partitioning. Woodland establishment may increase interception and soil structure over time but can also increase water use. Evaluate flood timing, total yield, season and scale separately; retaining more water before a storm can reduce unused capacity during it.
Abstraction, reservoirs and transfers — Taking water from rivers or aquifers can reduce stores and alter low flows, while reservoirs store and redistribute flows according to operation rules. Water may be returned after use or transferred across basins, so gross abstraction is not always net consumption. Assess release timing, environmental requirements and drought storage alongside supply benefits.
Natural flood management as a tested approach — Measures such as restoring wetlands, changing land management, woodland and slowing connected flow paths aim to influence storage and routing. Their success depends on site, maintenance, scale and event magnitude. UKCEH studies monitor and model these effects; a plausible mechanism is not enough to claim a fixed percentage reduction at every downstream settlement.
Compare evidence before inferring cause — Before-and-after hydrographs need comparable rainfall and antecedent conditions, and a comparison basin can help distinguish wider weather variation. Gauge calibration, changes in the stage-discharge relationship, missing data and spatial sampling affect confidence. Use multiple events and mechanisms rather than treating one lower post-intervention peak as decisive proof.
The confirmed River Exe catchment study — The school has confirmed the River Exe. Apply the general catchment methods to its verified boundaries, geology, land use, rainfall/flow records and sustainable supply or flood management; K5G16 develops the published Exe evidence. Distinguish a gauge's contributing area from the whole basin and published observations from personal data. A named teaching study does not supply or certify an individual fieldwork report.
Collecting and handling catchment data — Choose feasible observation methods with a clear question, timing and sampling rationale. Distinguish a rain gauge's point depth from basin-average rainfall and a single stream measurement from a time series. Record units, weather, method limitations and source provenance. Any practice measurements supplied in these notes are invented for calculation and cannot be claimed as the learner's collected data.
An evidence-led geographical judgement — Explain a pathway from cause to store/transfer change to observed outcome, then weigh competing explanations and uncertainty. Use quantities with dates and denominators and distinguish observed change from a projected scenario. A defensible conclusion might identify conditions under which an intervention is useful rather than rank every approach as universally best.
Test yourself
50 questions · Random sets of 10. These quick checks support revision; practise longer explanations and justified judgements too.
 Mr Kidman's Classroom