Mr Kidman's Classroom


Revise the key ideas
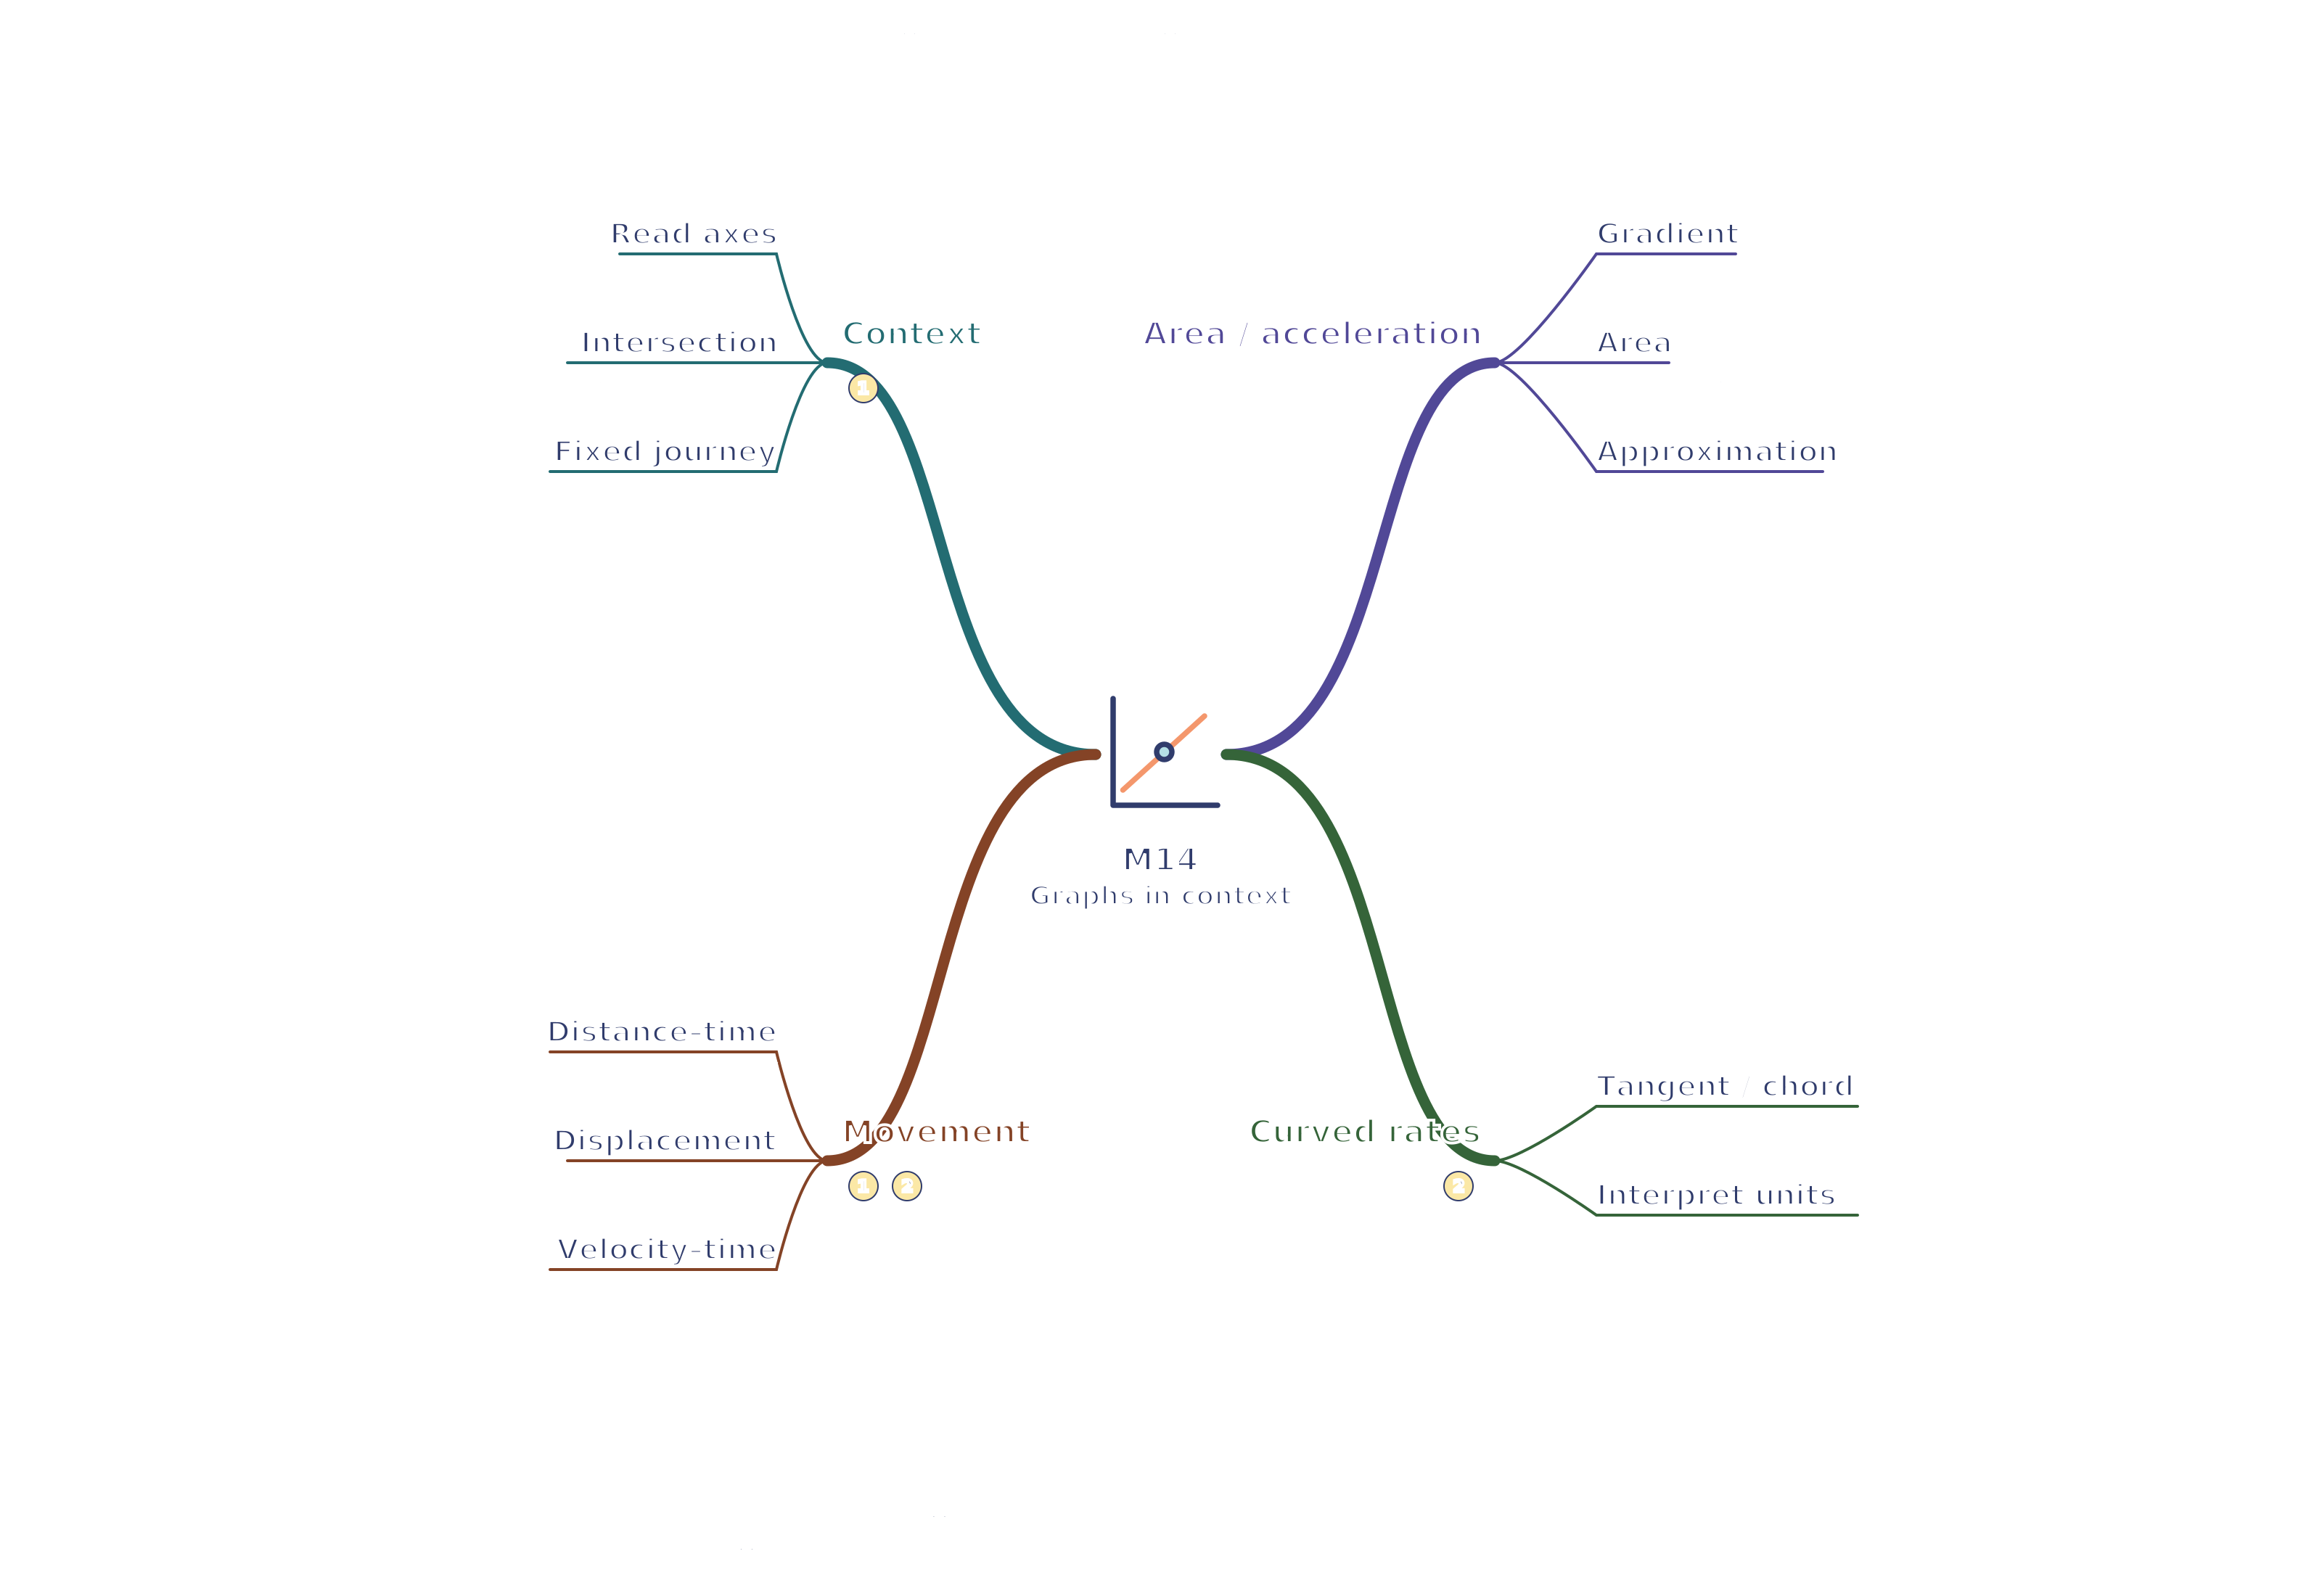
Graphs in real contexts
- Always identify each axis, its units and its scale. A point (3, 12) might mean 12 kilometres after 3 hours; it does not automatically describe speed.
- On a distance-time graph, gradient is speed. A straight rising line shows constant speed; a horizontal section shows no change in distance. A curve becoming steeper shows increasing speed.
A distance-time journey - Worked example: A distance increases from 4 km to 16 km between 1 h and 3 h. Speed = = 6 km/h.
- Displacement is the change in position from the starting point, measured in a stated direction. On a displacement-time graph, gradient is signed velocity. A decreasing graph can mean movement back towards the starting point; the total distance travelled cannot decrease.
- On a velocity-time graph, a horizontal line means constant velocity. Negative velocity means travel in the opposite direction, rather than negative speed.
Velocity increasing at constant acceleration - Use tables and plotted points for an unfamiliar relationship; interpret intersections, intercepts and trends in the situation. A model can be valid only over a stated range.
- Worked example: Two taxi fares C = 4 + 2d and C = 7 + 1.5d are equal at their intersection. 4 + 2d = 7 + 1.5d gives d = 6 km and C = £16.
- Reciprocal graphs can model a fixed journey: time = . Doubling the speed halves the time only when the distance is unchanged.
Higher — acceleration and area
- Gradient of a velocity-time graph is acceleration, with units m/s2 when velocity is in m/s and time in s. A straight sloping line means constant acceleration.
- Area under a velocity-time graph gives signed displacement. For distance travelled, add the magnitudes of areas above and below the time axis.
Magnitude means size without its positive or negative sign. If the signed areas are +12 m and −4 m, displacement is 12 − 4 = 8 m, but distance travelled is 12 + 4 = 16 m.
- Worked example: Velocity increases from 0 to 8 m/s over 4 s. Acceleration = 8 ÷ 4 = 2 m/s2; displacement is triangle area × 4 × 8 = 16 m.
- Estimate area under a curved graph using rectangles or trapezia. Smaller strips usually improve the estimate; state that the result is approximate.
- For an instantaneous rate at a point on a curve, draw a tangent there and find its gradient using two points on the tangent, not two arbitrary points on the curve.
Instantaneous means at that particular moment. A tangent is a straight line with the same direction as the curve at the chosen point.
- An average rate over an interval is the gradient of a chord (a straight line joining the two points at the ends of the interval). A tangent estimates the rate at one instant. These methods estimate rates by reading the graph; they do not require an algebraic rule for the curve’s gradient.
- For other graphs, interpret the units of gradient and area rather than assuming they always mean acceleration or displacement. A cost-versus-time gradient might represent pounds per hour.