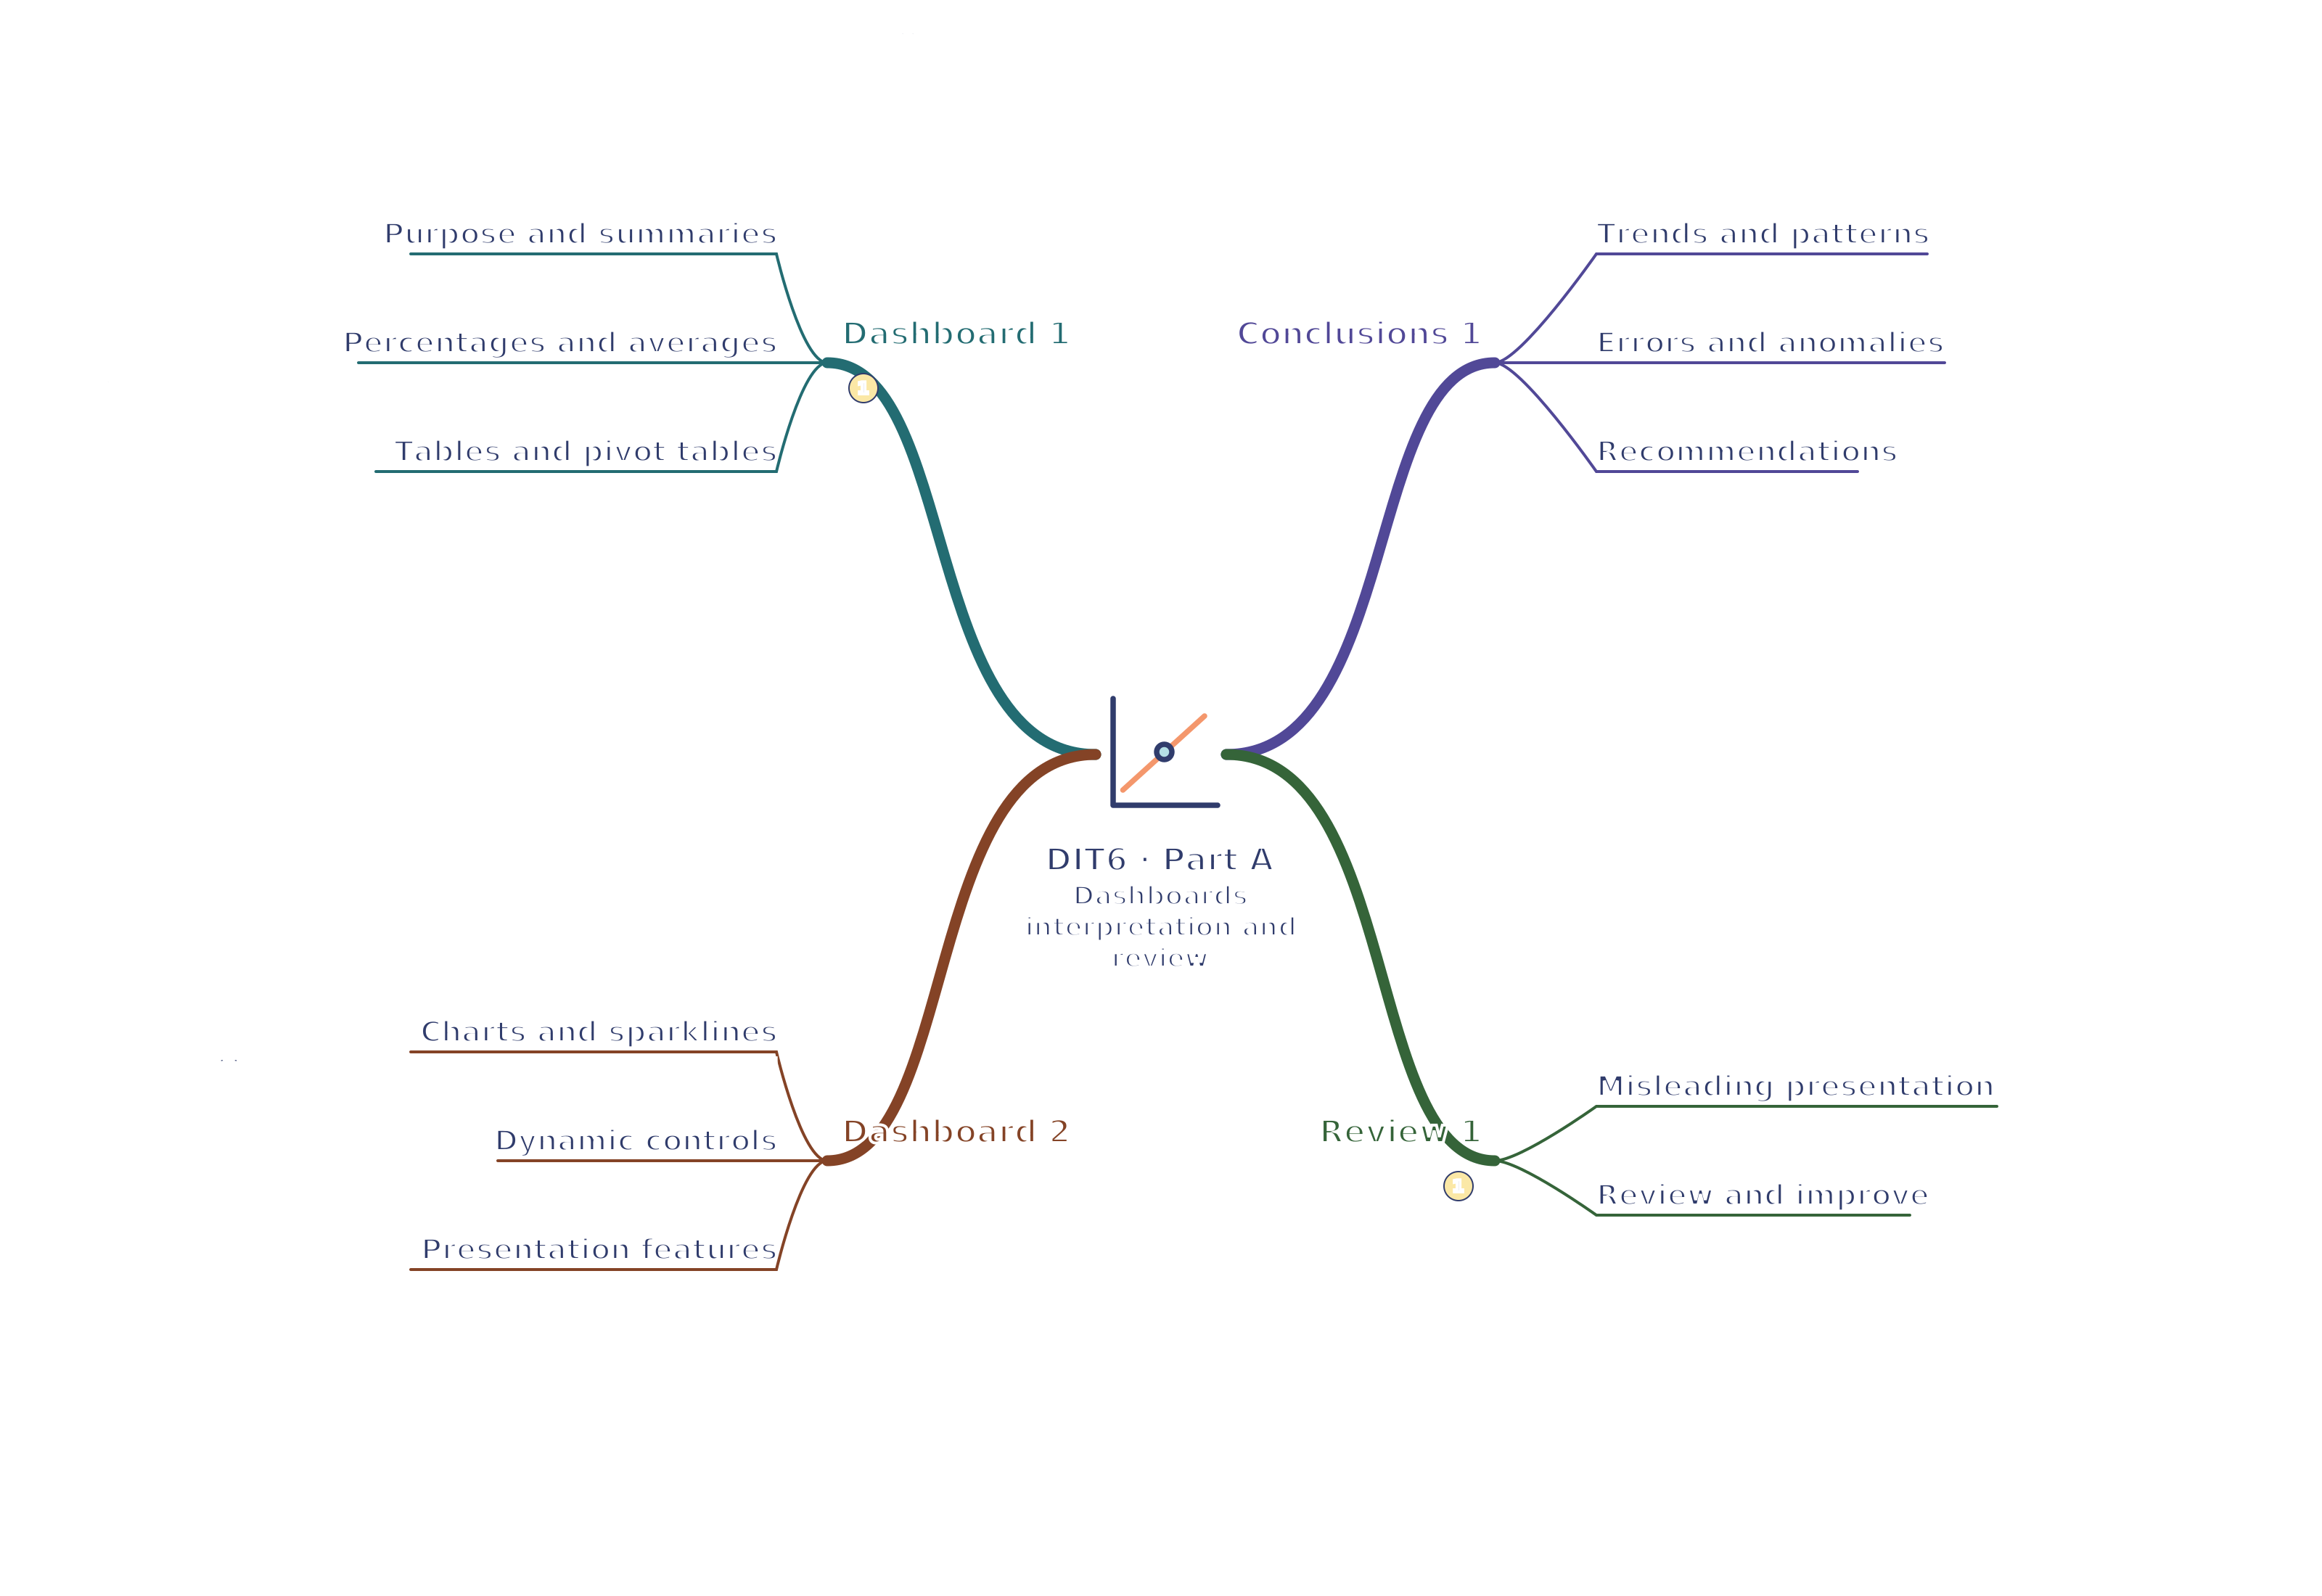
DIT6 · Dashboard 1 / Dashboard 2 / Conclusions 1 / Review 1 Dashboards interpretation and review mind map
Use your browser’s Print command for A4 landscape, or choose A3 in its paper settings. The SVG remains sharp when enlarged. A text version follows the map.
Read the mind map as text
Dashboard 1
Purpose and summaries: Decision-led totals, counts and breakdowns
Percentages and averages: State denominator; distinguish ticket and income share
Tables and pivot tables: Group fields; choose aggregation; refresh
Dashboard 2
Charts and sparklines: Match chart to comparison or time trend
Dynamic controls: Controls must change linked output correctly
Presentation features: Readable layout; titles, units and legends
Conclusions 1
Trends and patterns: Use actual variables; support claims with values
Errors and anomalies: Investigate unusual values; do not silently remove