Mr Kidman's Classroom



Revise the key ideas
Building a dashboard
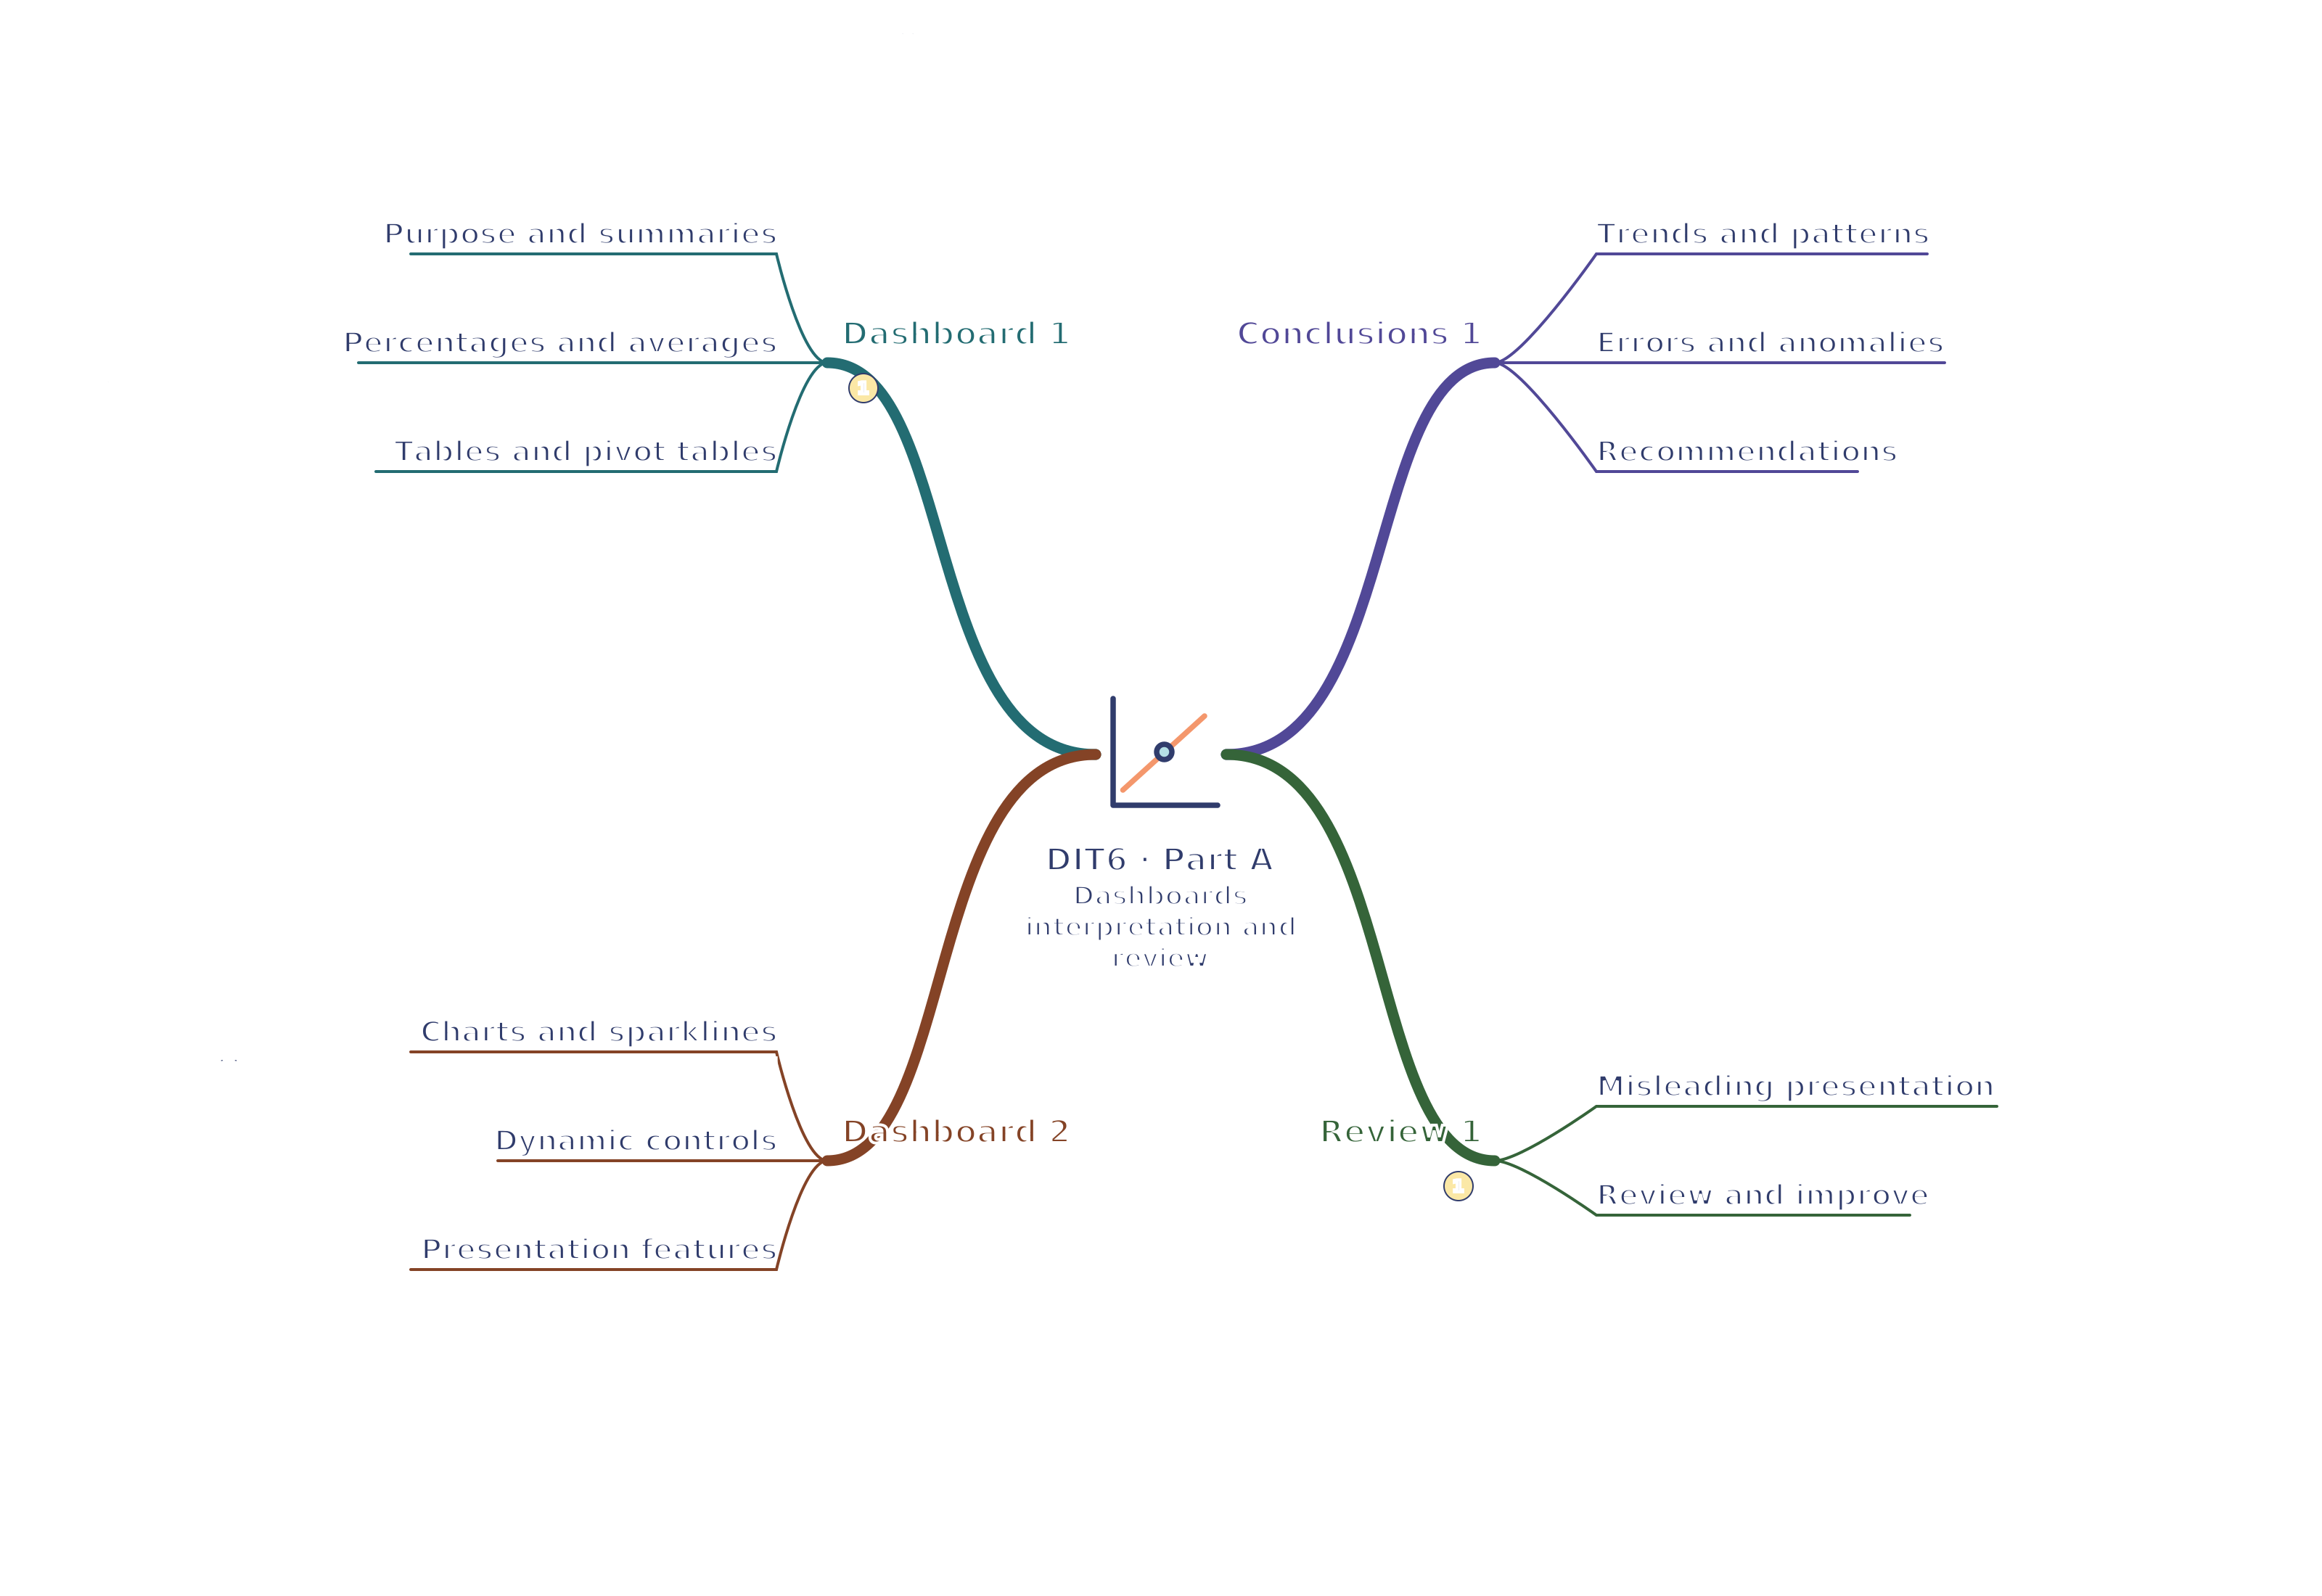
- Purpose and summaries — A dashboard combines selected measures so its audience can make a decision. A pool manager might need ticket totals, booking counts, average attendance, percentages and sales by session or department. Distinguish a count of records from tickets sold. State period, units, source and filters so a displayed 30 is understandable.
- Percentages and averages — In the fictional three-record pool data, Swim has 22 of 30 tickets: 22/30*100 = 73.33% approximately. Its income share is 110/158*100 = 69.62% approximately, a different measure. Average tickets per record is 30/3 = 10. Label the denominator, rounding and whether each record represents a comparable session.
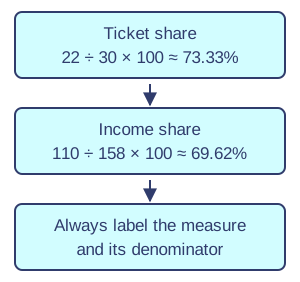
Ticket share and income share differ. Original illustration. Open full-size diagram - Tables and pivot tables — Use a table when exact figures matter. A pivot table groups and aggregates source records, such as SUM of Tickets by Session. Check whether the field is summarised by count or sum, and refresh after data changes. Keep headings clear and avoid mixed units in one total. A pivot table reorganises data; it does not fix inaccurate source values.
- Charts and sparklines — Bar or column charts compare categories; line charts show change across ordered time points; pie charts show a limited set of parts of one meaningful whole. Sparklines give compact row-level trends but need context. Label axes, units and period. An income line is misleading if unrelated session categories are placed on a time-like axis.
- Dynamic charts and controls — A dynamic chart updates when linked selections or data change. A dropdown or combo box selects a session; a checkbox toggles an independent series; option buttons select one measure; a spinner changes a number; a button runs an action. Link each control to calculations or chart data and test the displayed selection, including no matching records.
- Presentation features — Use readable fonts, purposeful colours, wrapping, borders and shading to group summaries. Merge cells carefully for a display title, avoiding merged source-data records that obstruct sorting. Graphics should explain the topic rather than hide values. Provide an overall title, section headings and accurate axis labels. Conditional formatting needs meaningful thresholds and accessible alternatives.
Drawing conclusions
- Trends and patterns — A trend is an overall direction across an ordered variable such as time; a pattern is a recurring relationship. Quote supporting values and the relevant period. The tiny fictional dataset has no dates, so it supports a comparison of session types but not a month-by-month trend. Do not invent time information to make a stronger conclusion.
- Errors and anomalies — Investigate unusually large values, unexpected zeros, blanks, duplicates and totals that disagree. An anomaly may be a genuine event or an error. Check the original record and formula before correcting it; retain an audit of the change. A high-income session could reflect more tickets, a higher price or a data problem.
- Conclusions and recommendations — Connect a finding to a cautious decision and a limitation. Swim sold more tickets in the example, so the manager could investigate additional sessions, but three records cannot establish annual demand or capacity. Separate observation, possible explanation and recommendation. Correlation does not establish that one factor caused another.
Reviewing communication
- Misleading presentation — A truncated bar-chart axis can exaggerate differences; unequal time intervals, missing categories, selective dates and three-dimensional effects can distort comparisons. A percentage without its base hides scale. Explain how a viewer might be misled, then redraw or relabel it. Do not assume a visually dramatic chart provides stronger evidence.
A truncated axis cuts off part of the scale. For a bar chart, starting above zero can make a small numerical difference look like a much larger difference in bar lengths.
- Review and improve — Compare presentation methods with the audience's task: can a manager find the relevant totals and understand a selected period? Check labels, contrast, clutter, readability, controls and whether the summaries lead to biased or inaccurate conclusions. Justify a specific improvement and retest it. A dashboard can be attractive while displaying an outdated or inappropriate calculation.
Building a dashboard
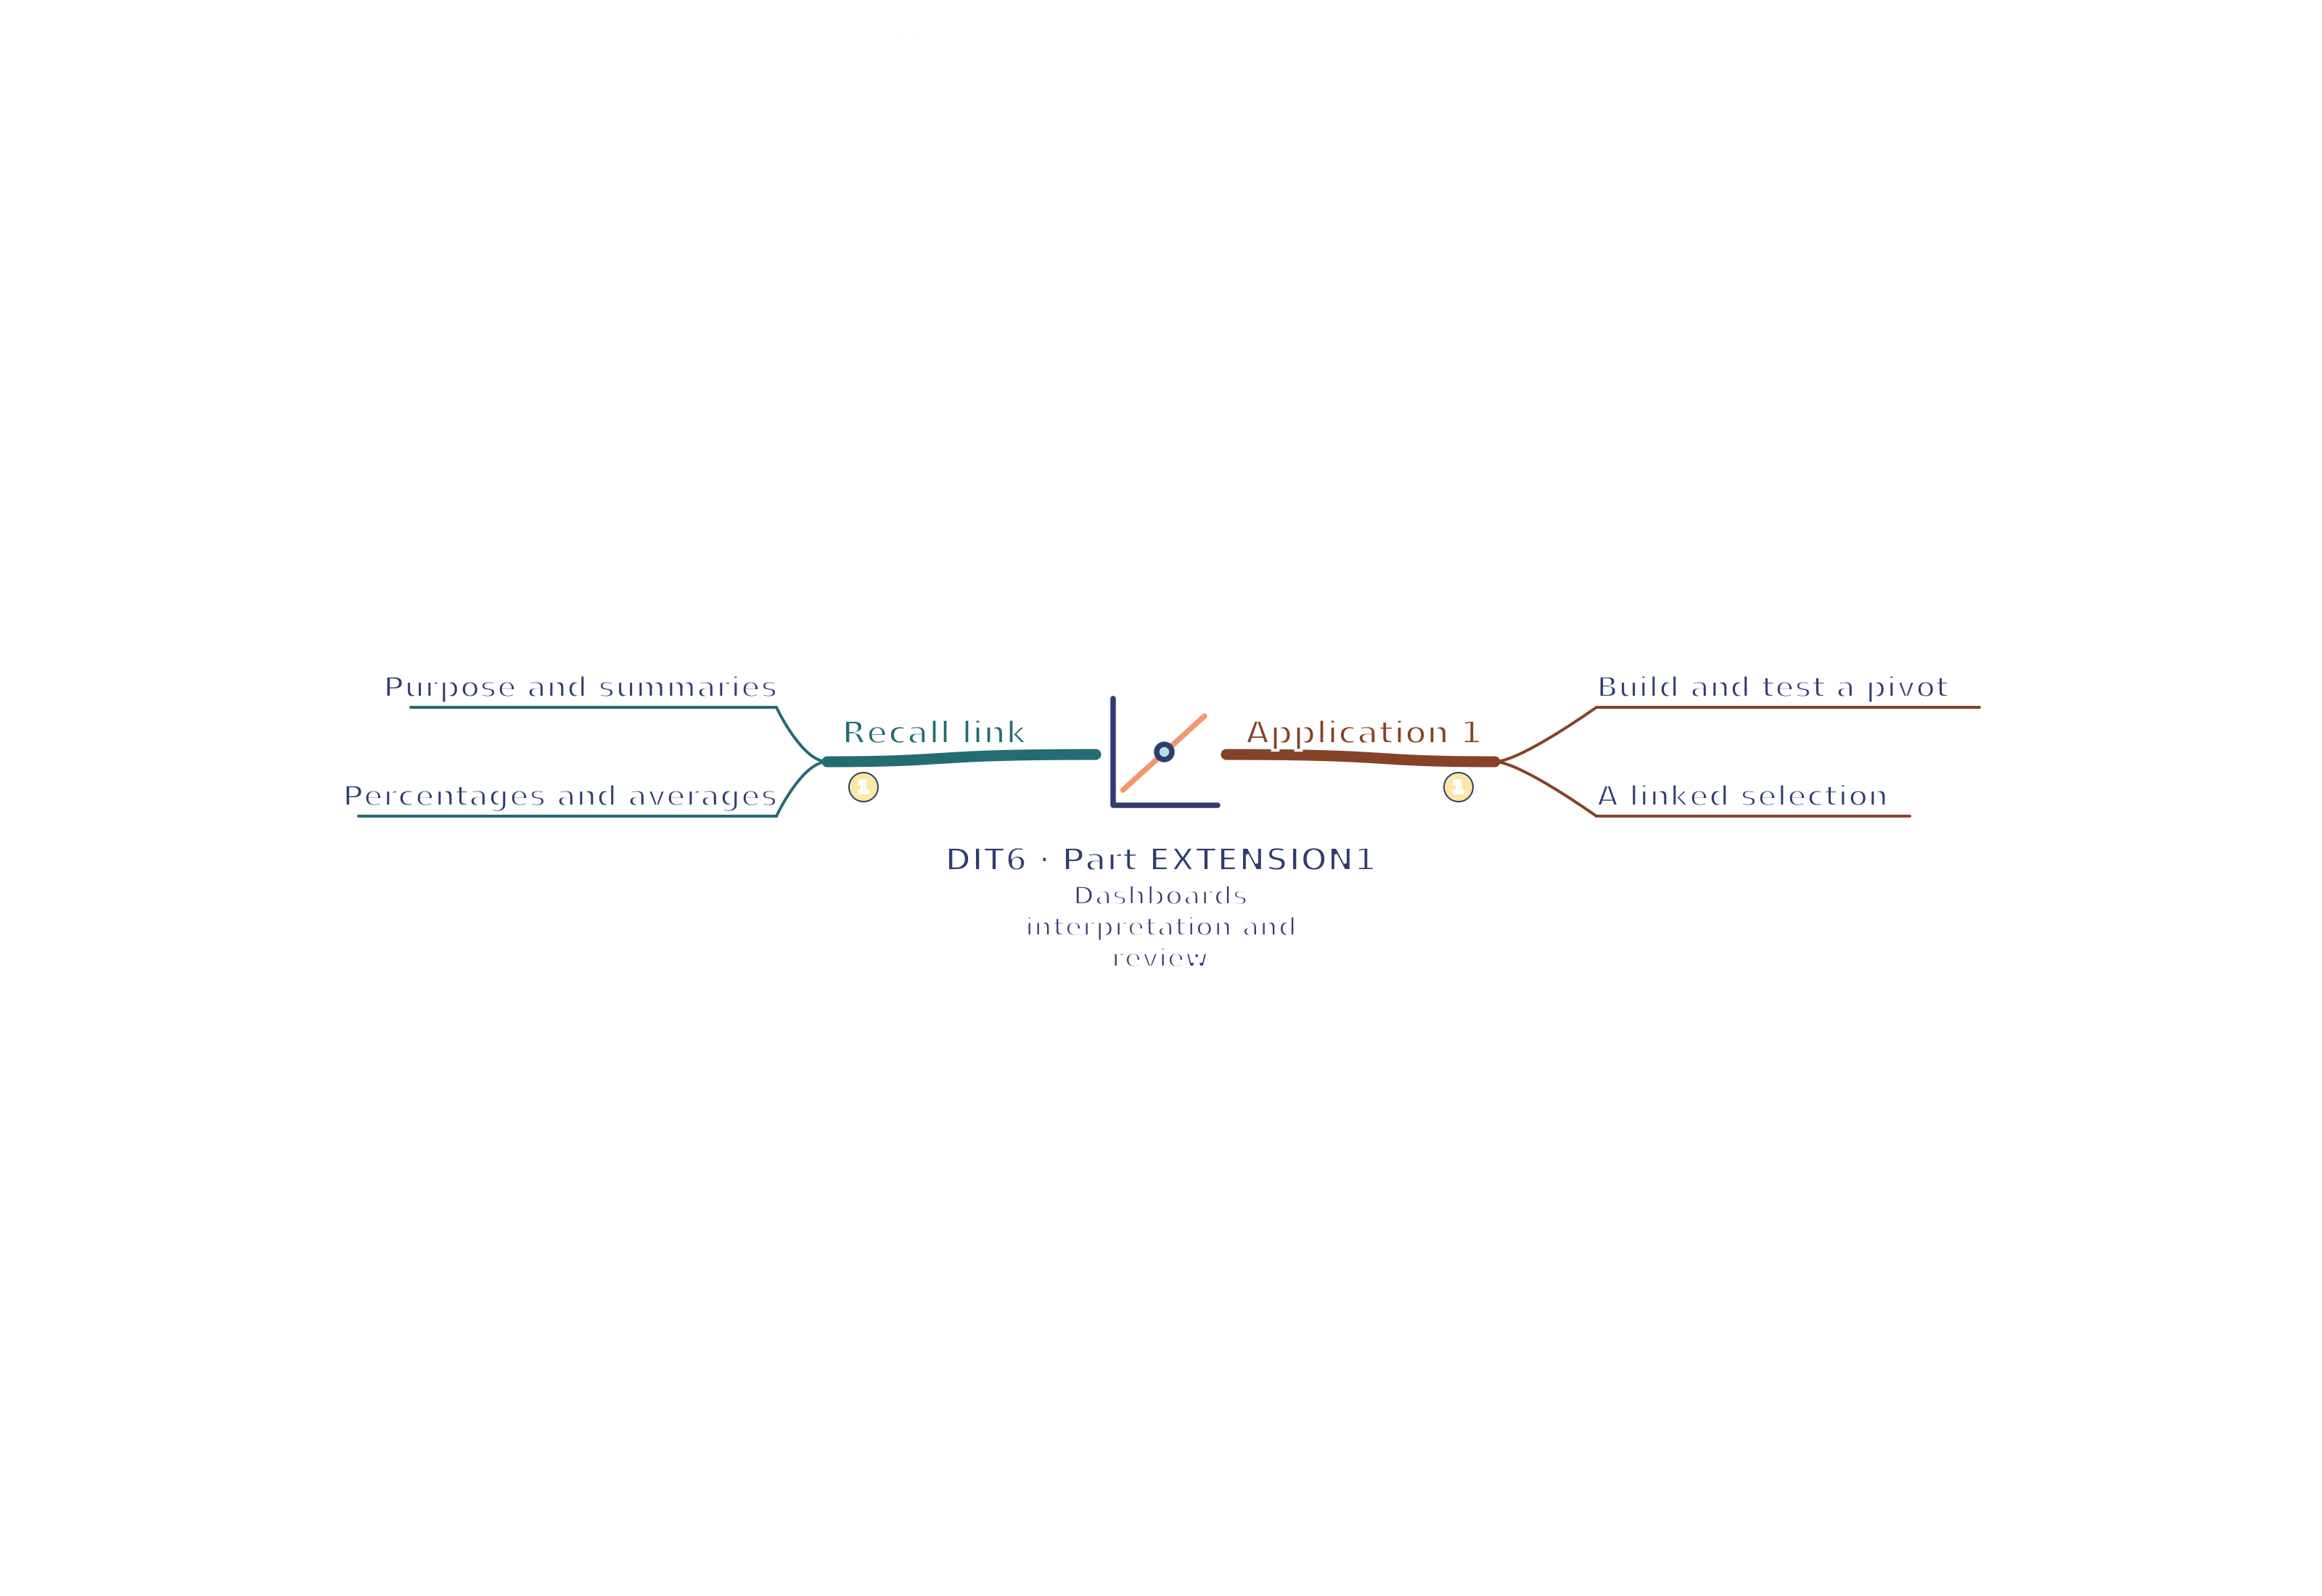
- Build and test a pivot — From the three existing booking records, place Session in the pivot rows and Tickets in the values area, summarised by SUM. The result is Swim 22, Aqua 8 and total 30. COUNT would instead give two Swim records and one Aqua record. That count is not ticket sales. Refresh after source changes and check that new records are included in the source range. Label the output with the measure and period before using it to recommend another session.
Building a dashboard
- A linked selection — Suppose a dropdown's linked cell contains the chosen session name. A conditional total can use that cell as its criterion, returning Swim's £110 or Aqua's £48 from the existing data. Link the displayed chart or measure to that calculated result. Test each allowed selection and a missing selection, with an understandable empty state. A dropdown that changes its own label while leaving a typed chart unchanged is not a working interactive dashboard.