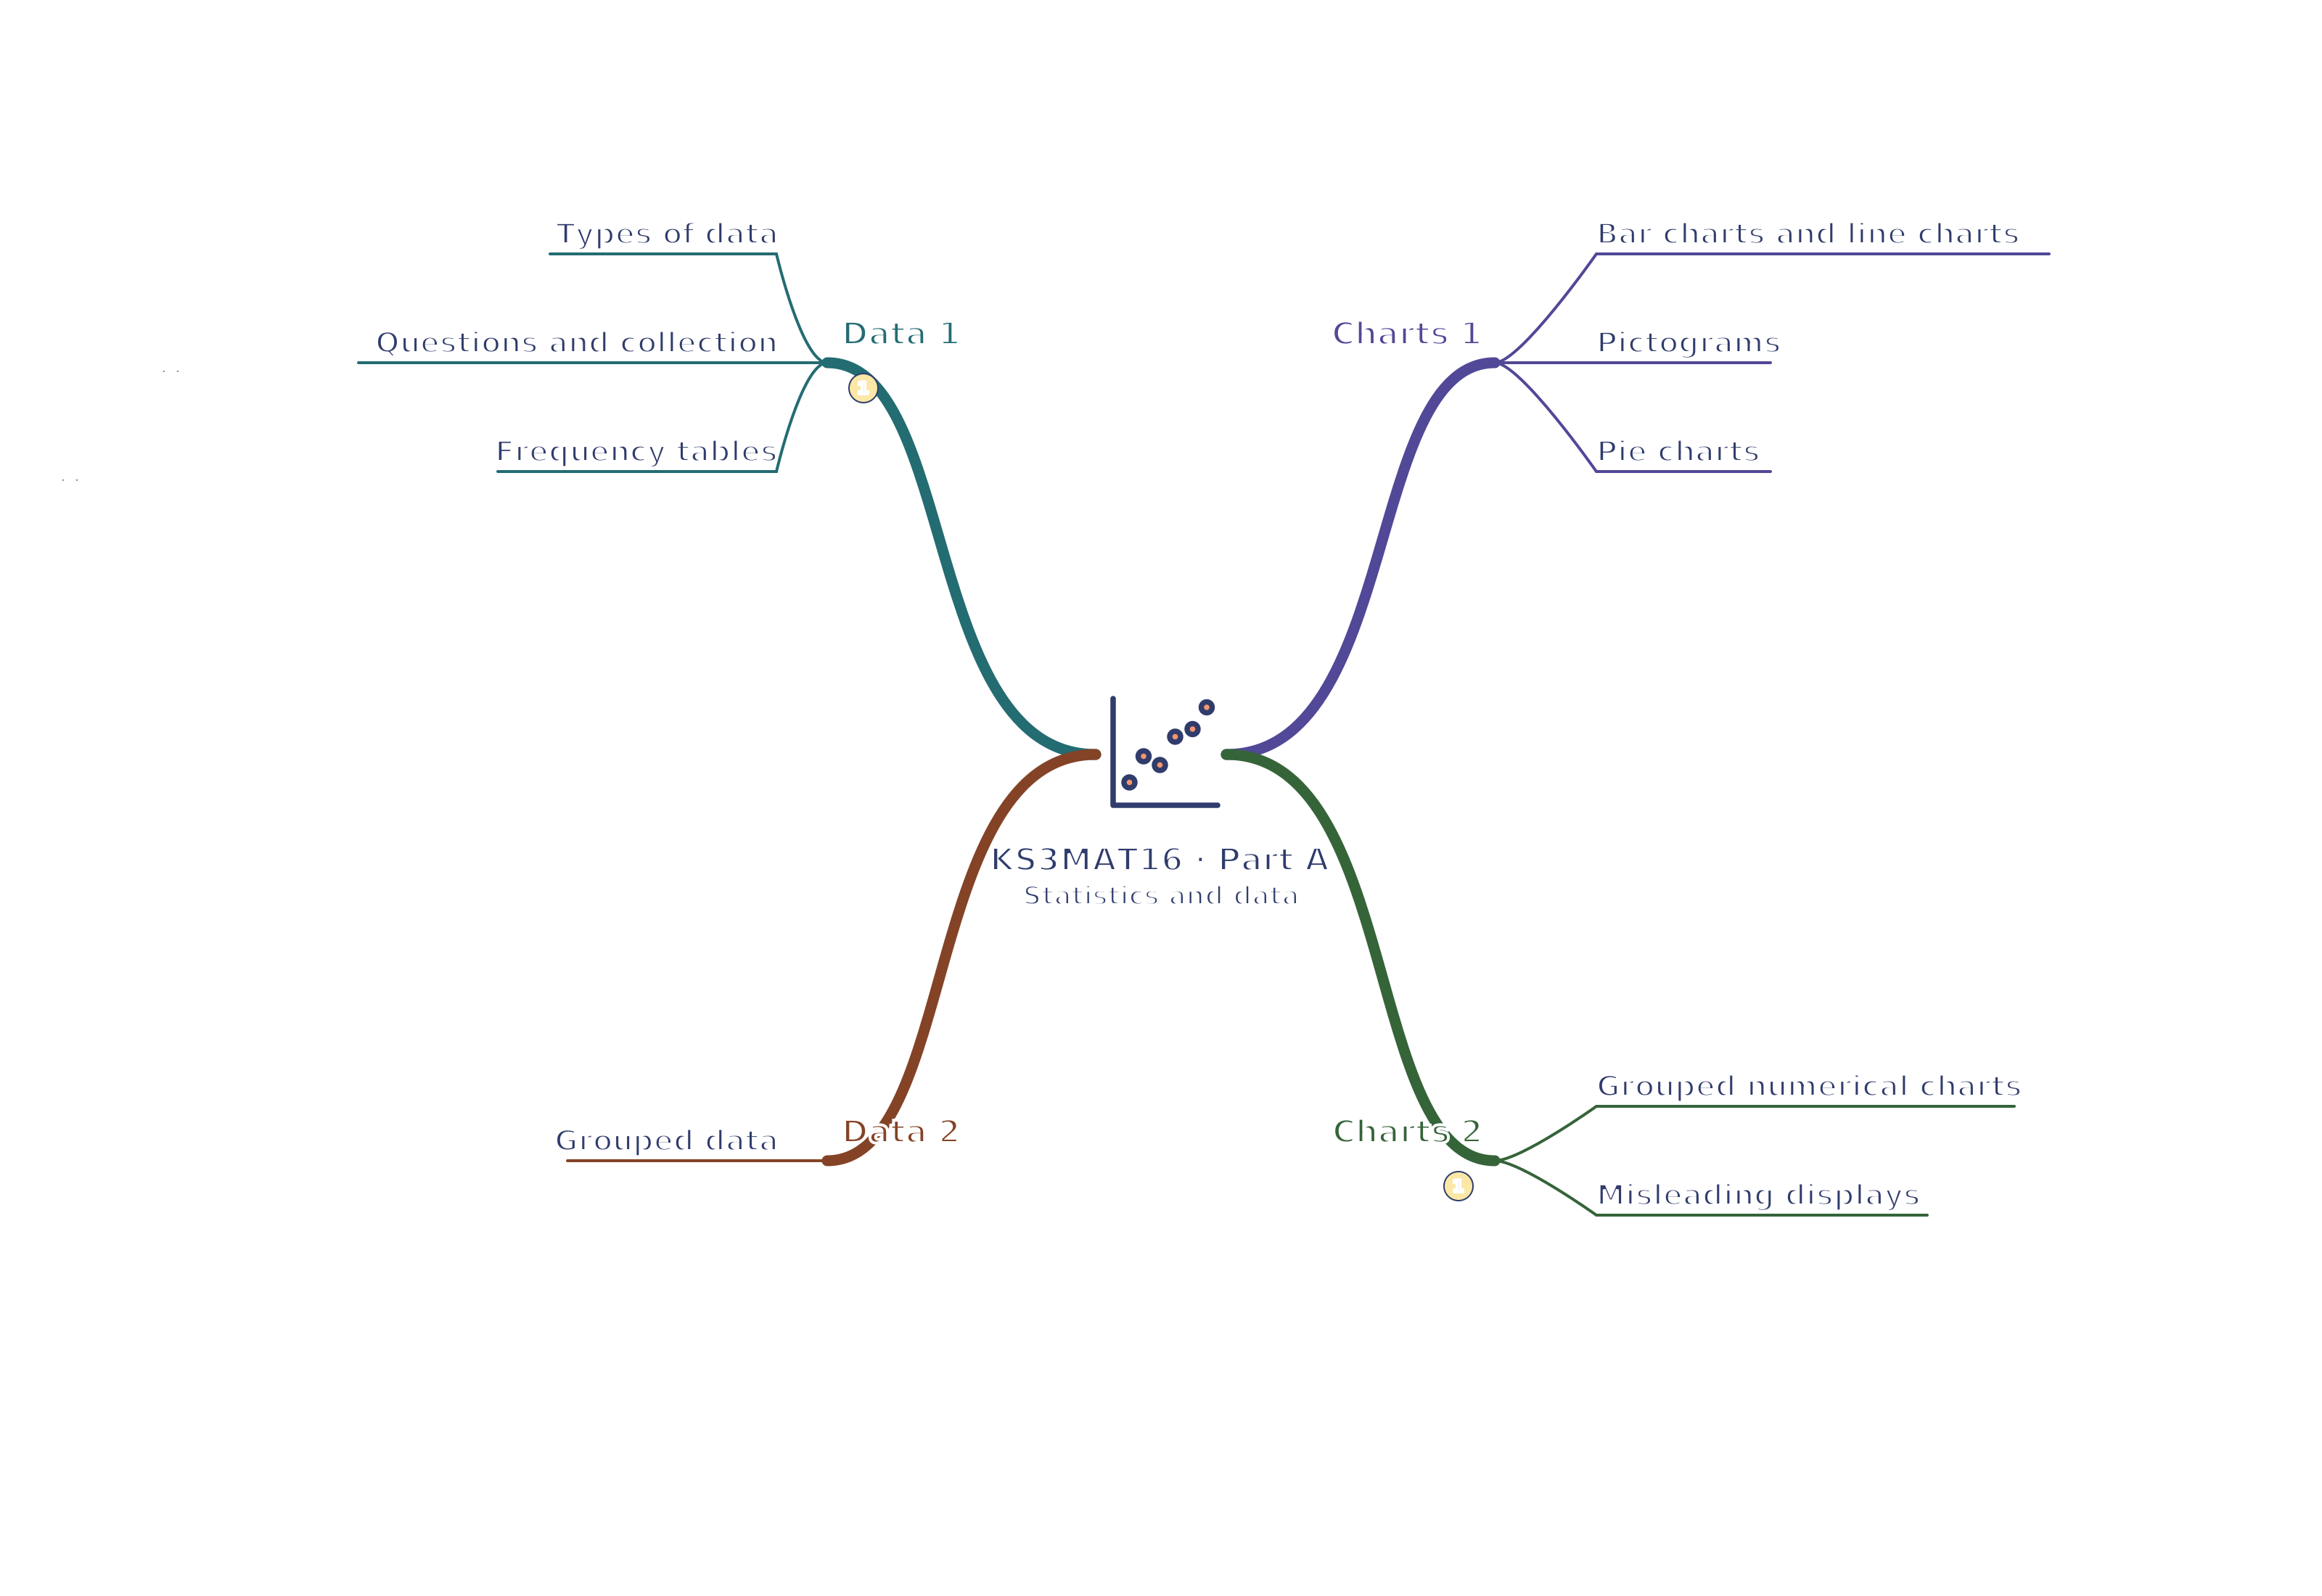
Use your browser’s Print command for A4 landscape, or choose A3 in its paper settings. The SVG remains sharp when enlarged. A text version follows the map.
Read the mind map as text
Data 1
Types of data: The quantity, not the written format, determines type.
Questions and collection: Match the collection method to the question.
Frequency tables: Multiply values by their frequencies when summing.
Data 2
Grouped data: State interval boundaries and lost precision.
Charts 1
Bar charts and line charts: Choose a graph that matches the data type.
Pictograms: The key determines the count.
Pie charts: Part of total becomes part of a full turn.
Charts 2
Grouped numerical charts: An interval bar summarises many possible values.
Misleading displays: Inspect the scale as well as the pattern.
Connections
Data 1 → Charts 2: Representations support qualified conclusions