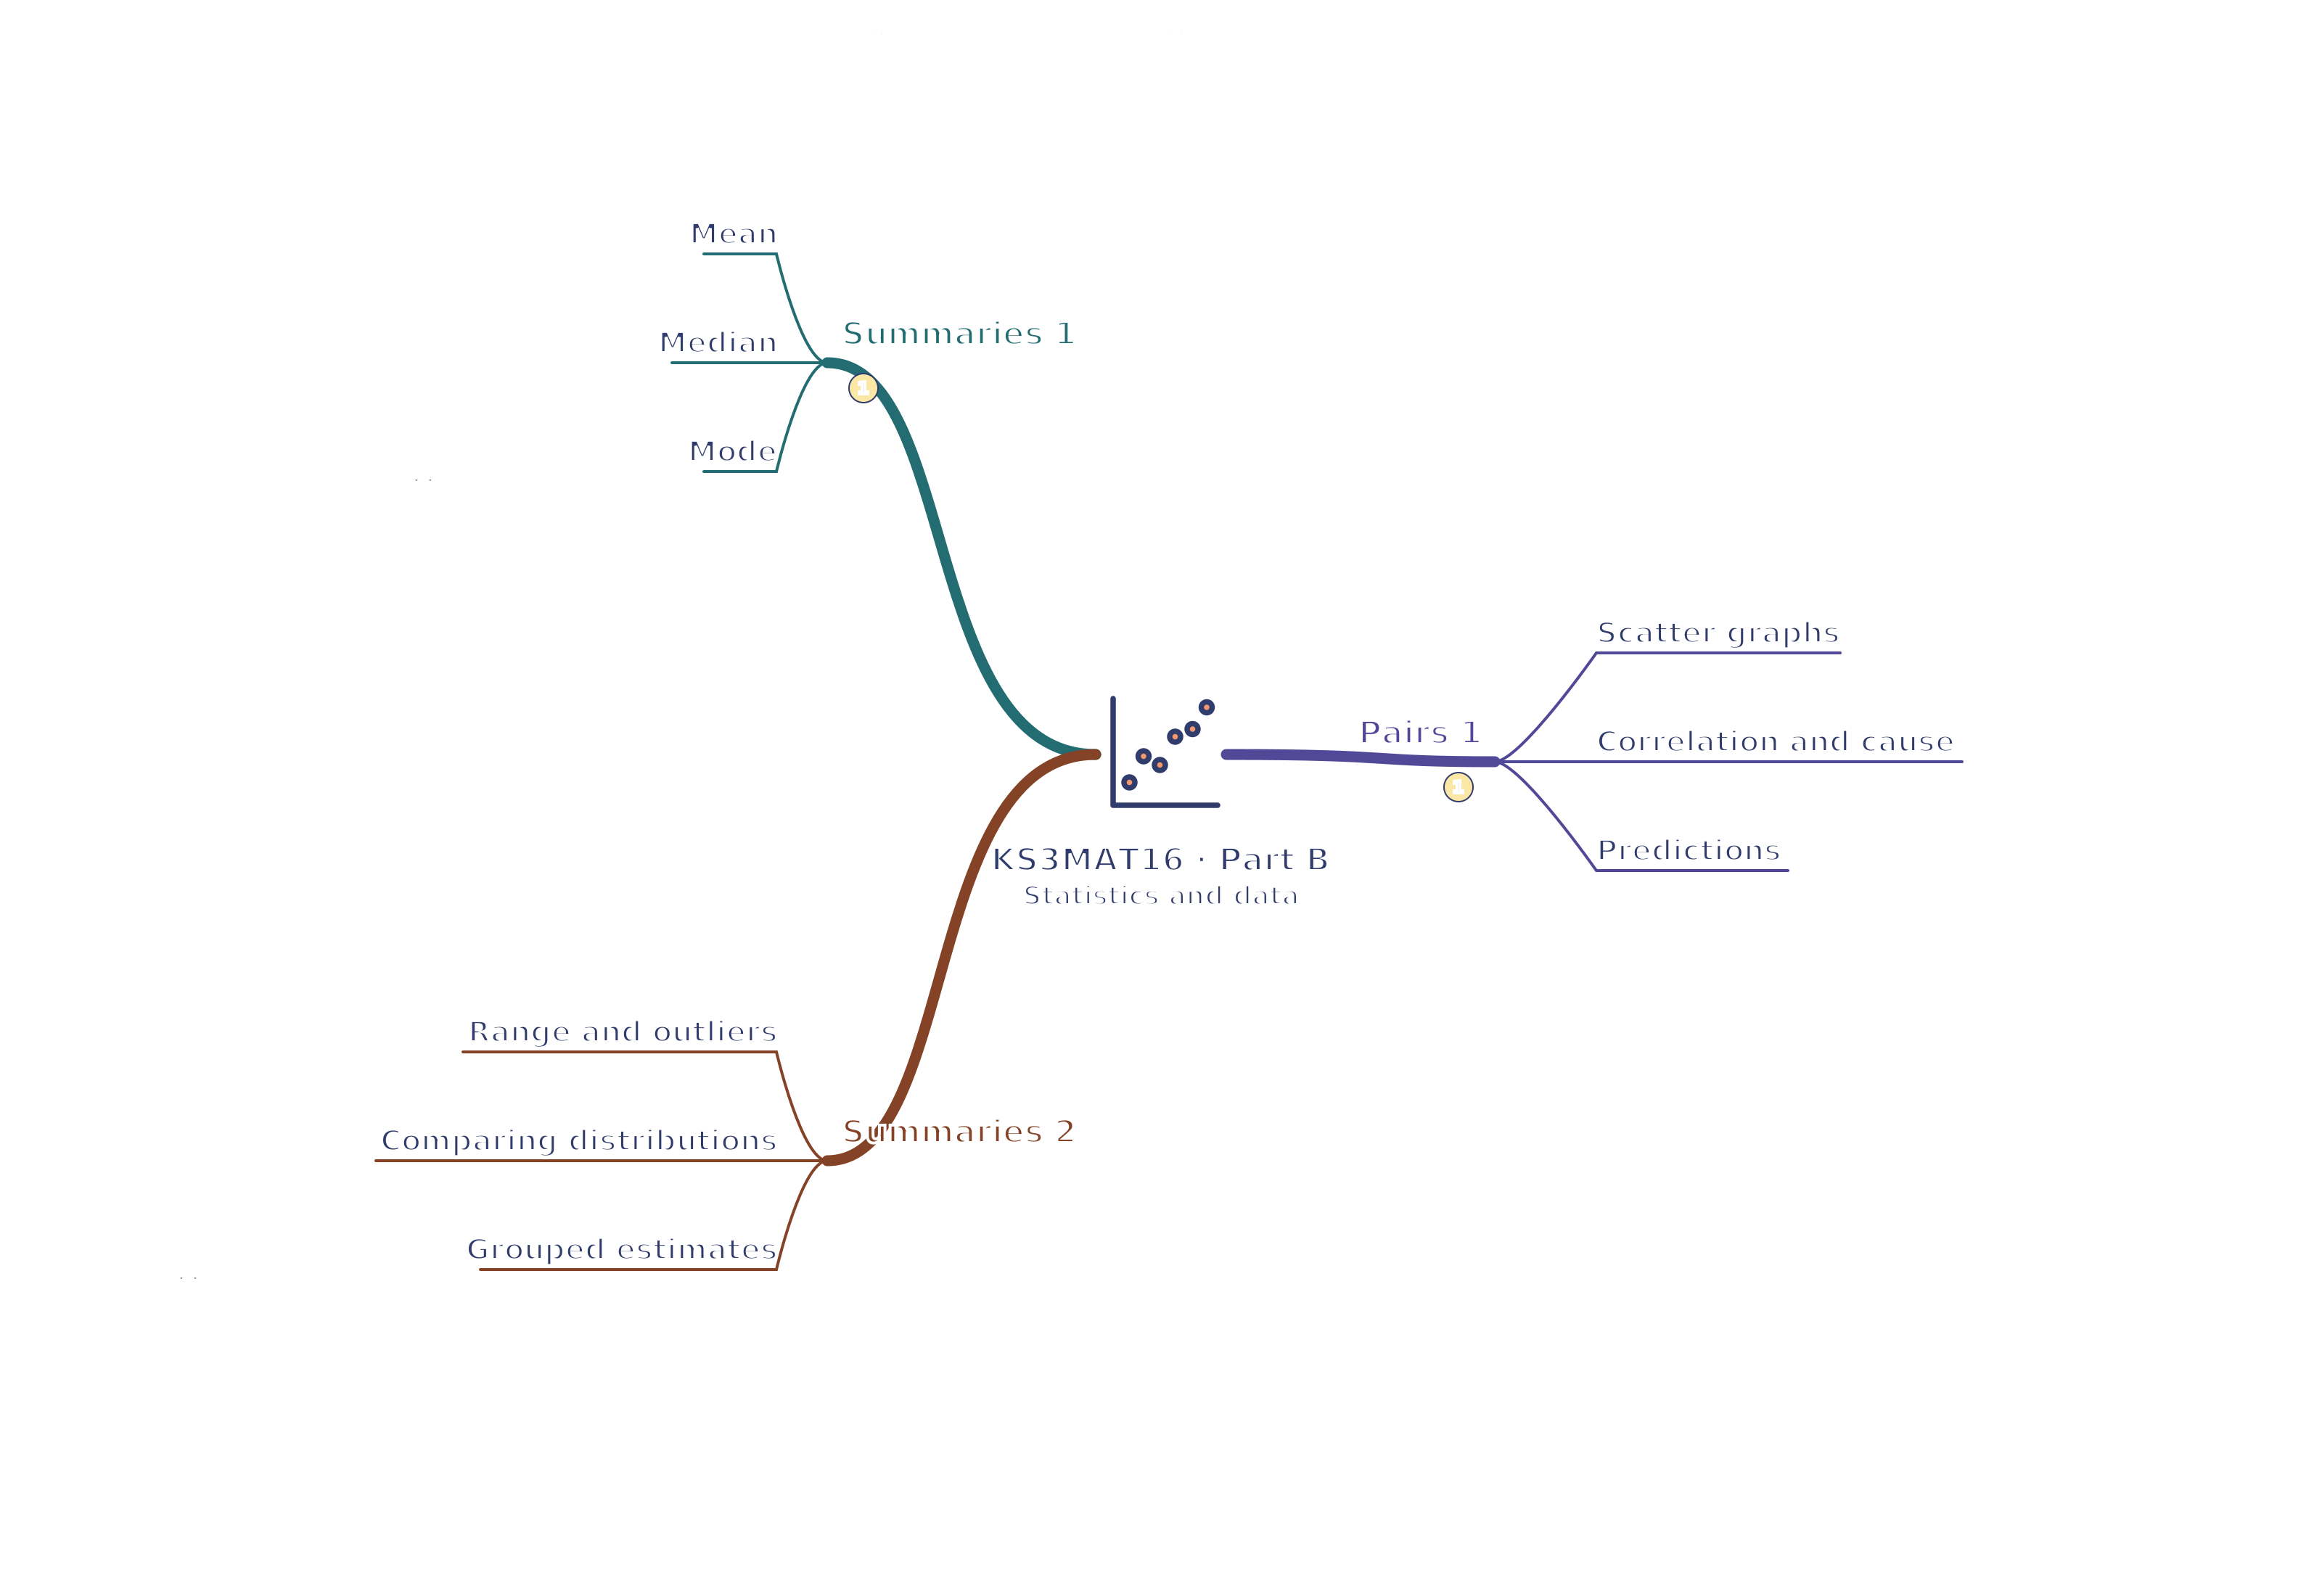
Use your browser’s Print command for A4 landscape, or choose A3 in its paper settings. The SVG remains sharp when enlarged. A text version follows the map.
Read the mind map as text
Summaries 1
Mean: Total divided by observation count.
Median: Order first; position is not the value.
Mode: Most frequent, not largest.
Summaries 2
Range and outliers: Spread and centre describe different features.
Comparing distributions: Compare typical value and consistency.
Grouped estimates: Midpoints supply an explicit approximation.
Pairs 1
Scatter graphs: Each point must preserve its original pair.
Correlation and cause: A shared cause can create a correlation.
Predictions: Stay within the evidence and state uncertainty.
Connections
Summaries 1 → Pairs 1: Representations support qualified conclusions