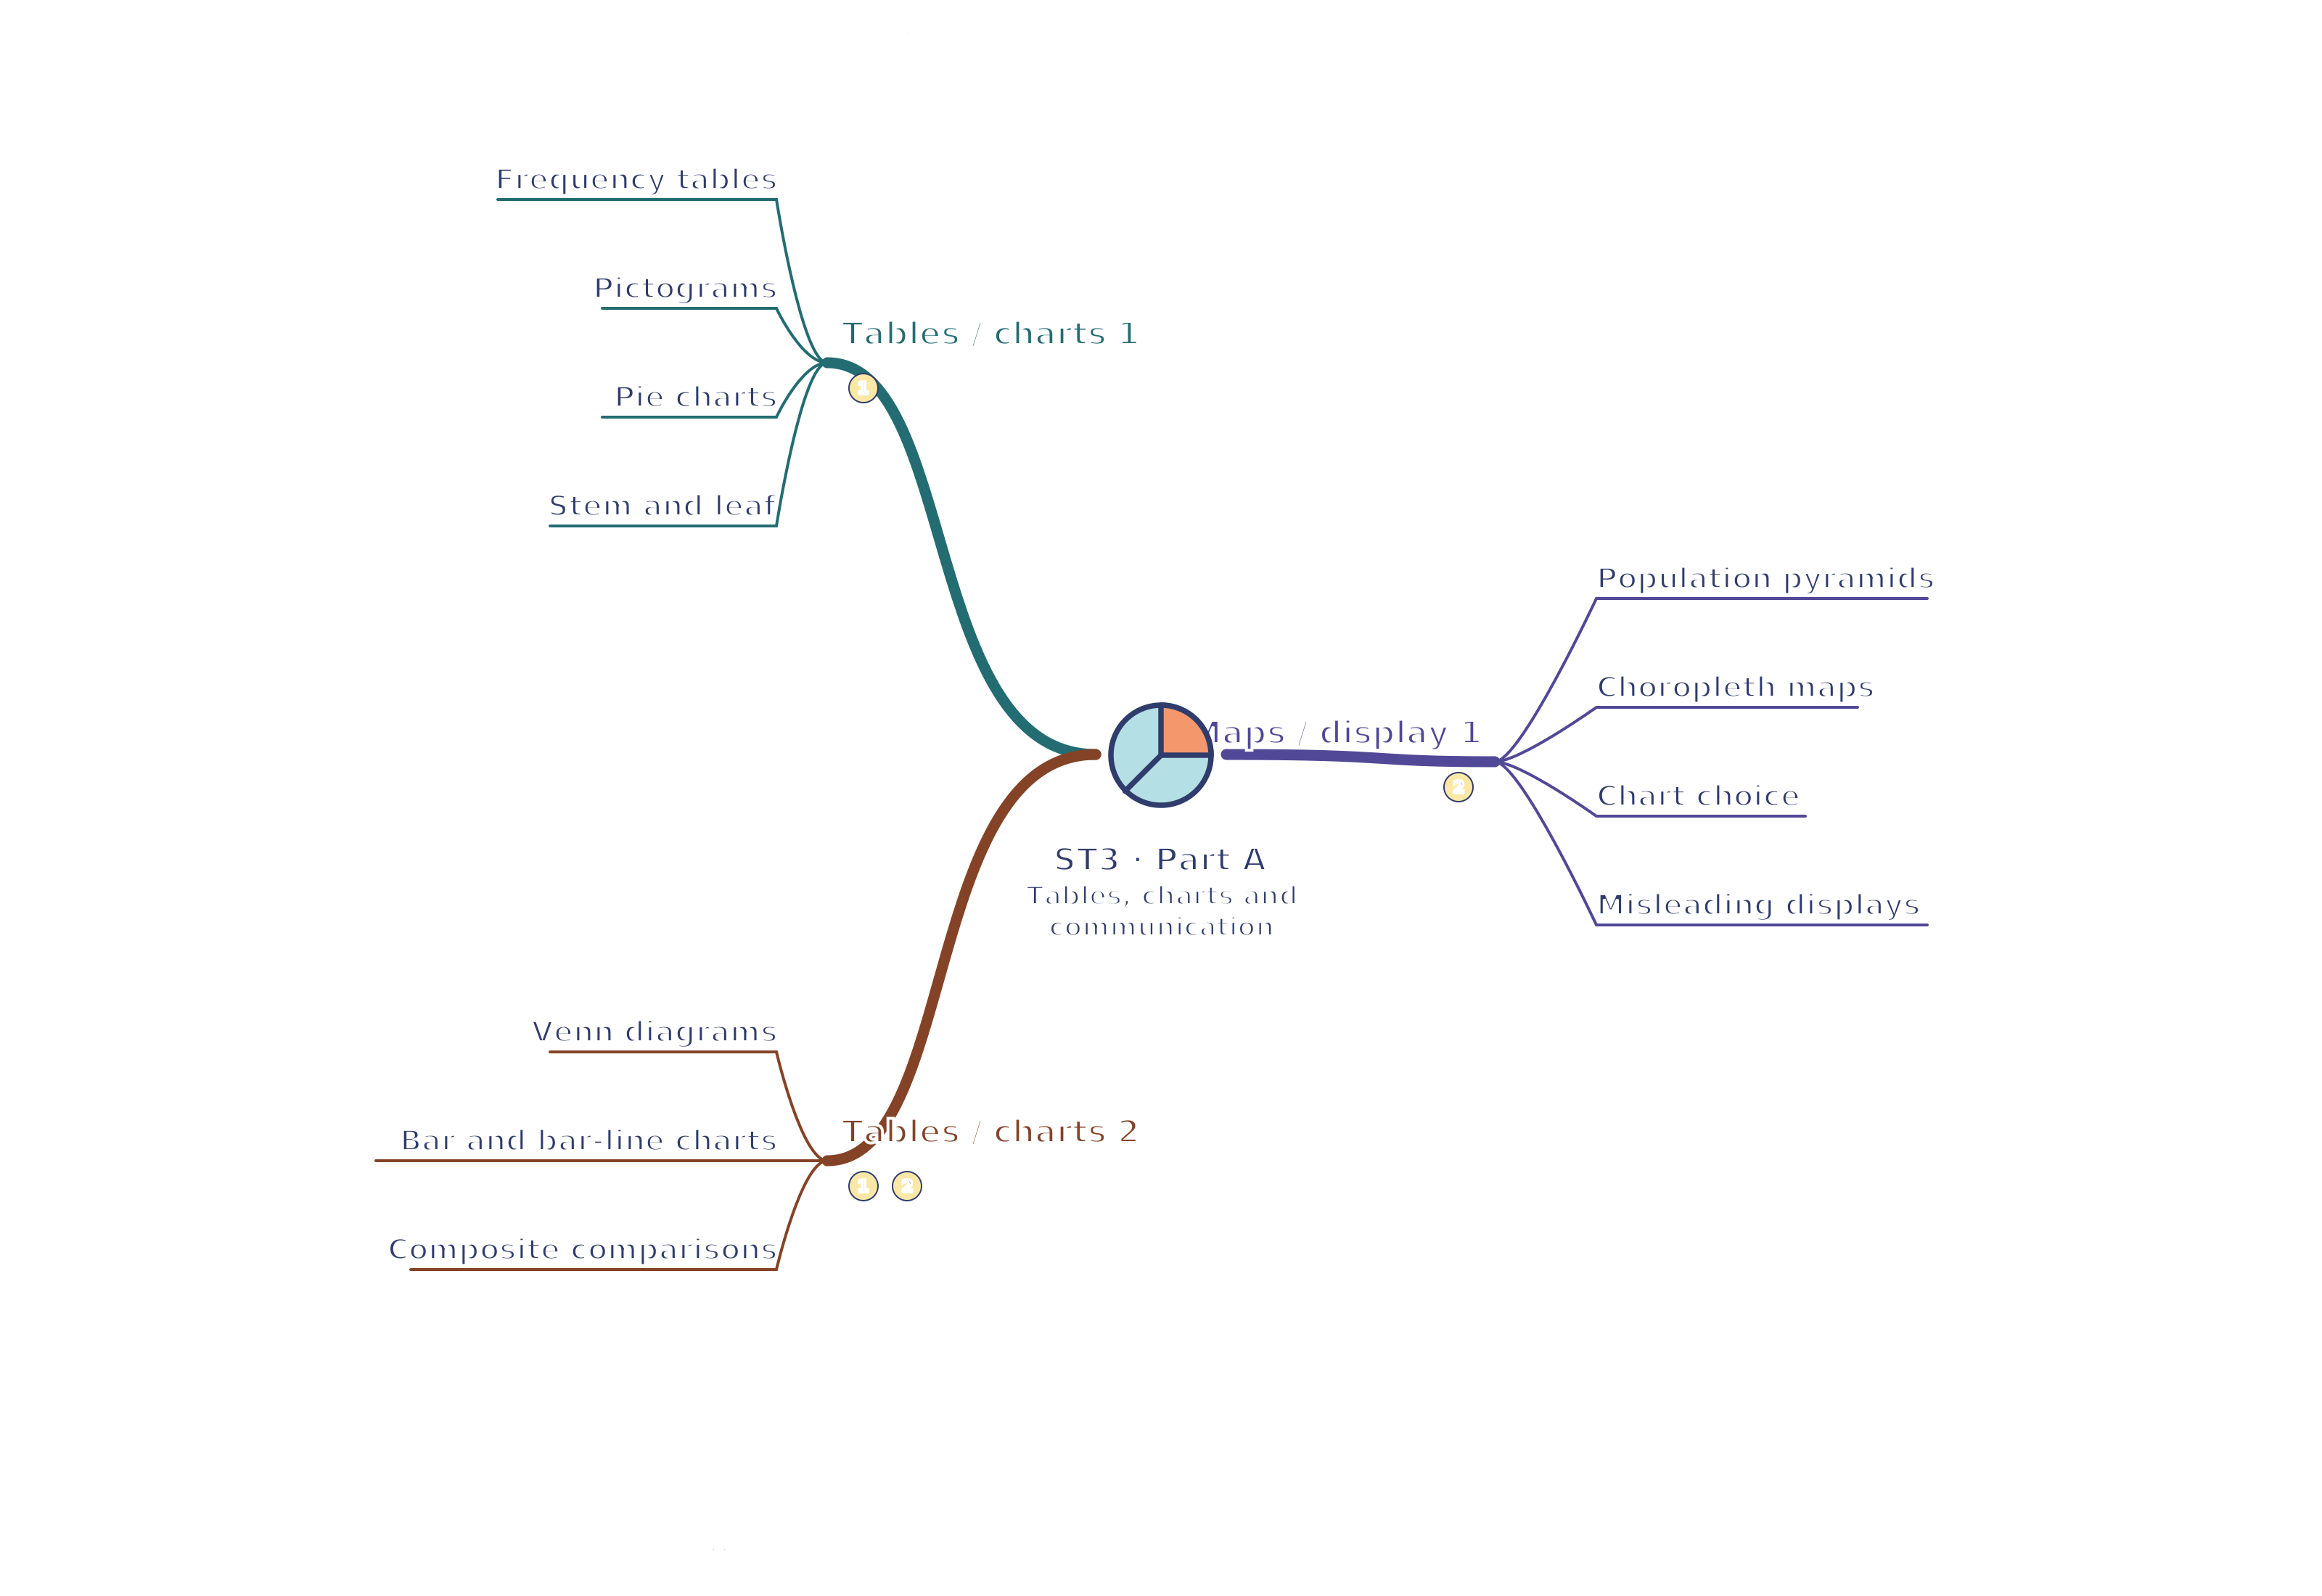
ST3 · Tables / charts 1 / Tables / charts 2 / Maps / display 1 Tables, charts and communication mind map
Use your browser’s Print command for A4 landscape, or choose A3 in its paper settings. The SVG remains sharp when enlarged. A text version follows the map.
Read the mind map as text
Tables / charts 1
Frequency tables: Count, total and cross-classify accurately.
Pictograms: A key defines the value of each symbol.
Pie charts: Angle represents proportion of the whole.
Stem and leaf: Ordered leaves and key preserve exact data.
Tables / charts 2
Venn diagrams: Exclusive regions; overlap belongs to both sets.
Bar and bar-line charts: Categories use bars; discrete values can use lines.
Composite comparisons: Stacked percentages compare composition, not total size.
Maps / display 1
Population pyramids: Compare matched age bands and stated scale.
Choropleth maps: Read legend; distinguish area from population.
Chart choice: Representation must fit data and audience.
Misleading displays: Check scales, dimensions and omitted categories.
Connections
Tables / charts 1 → Tables / charts 2: Counts and keys underlie Venn totals and fair bar-chart composition comparisons.
Tables / charts 2 → Maps / display 1: Category and group denominators also govern pyramid and regional-map comparisons.