Mr Kidman's Classroom


Revise the key ideas
Tables and familiar charts
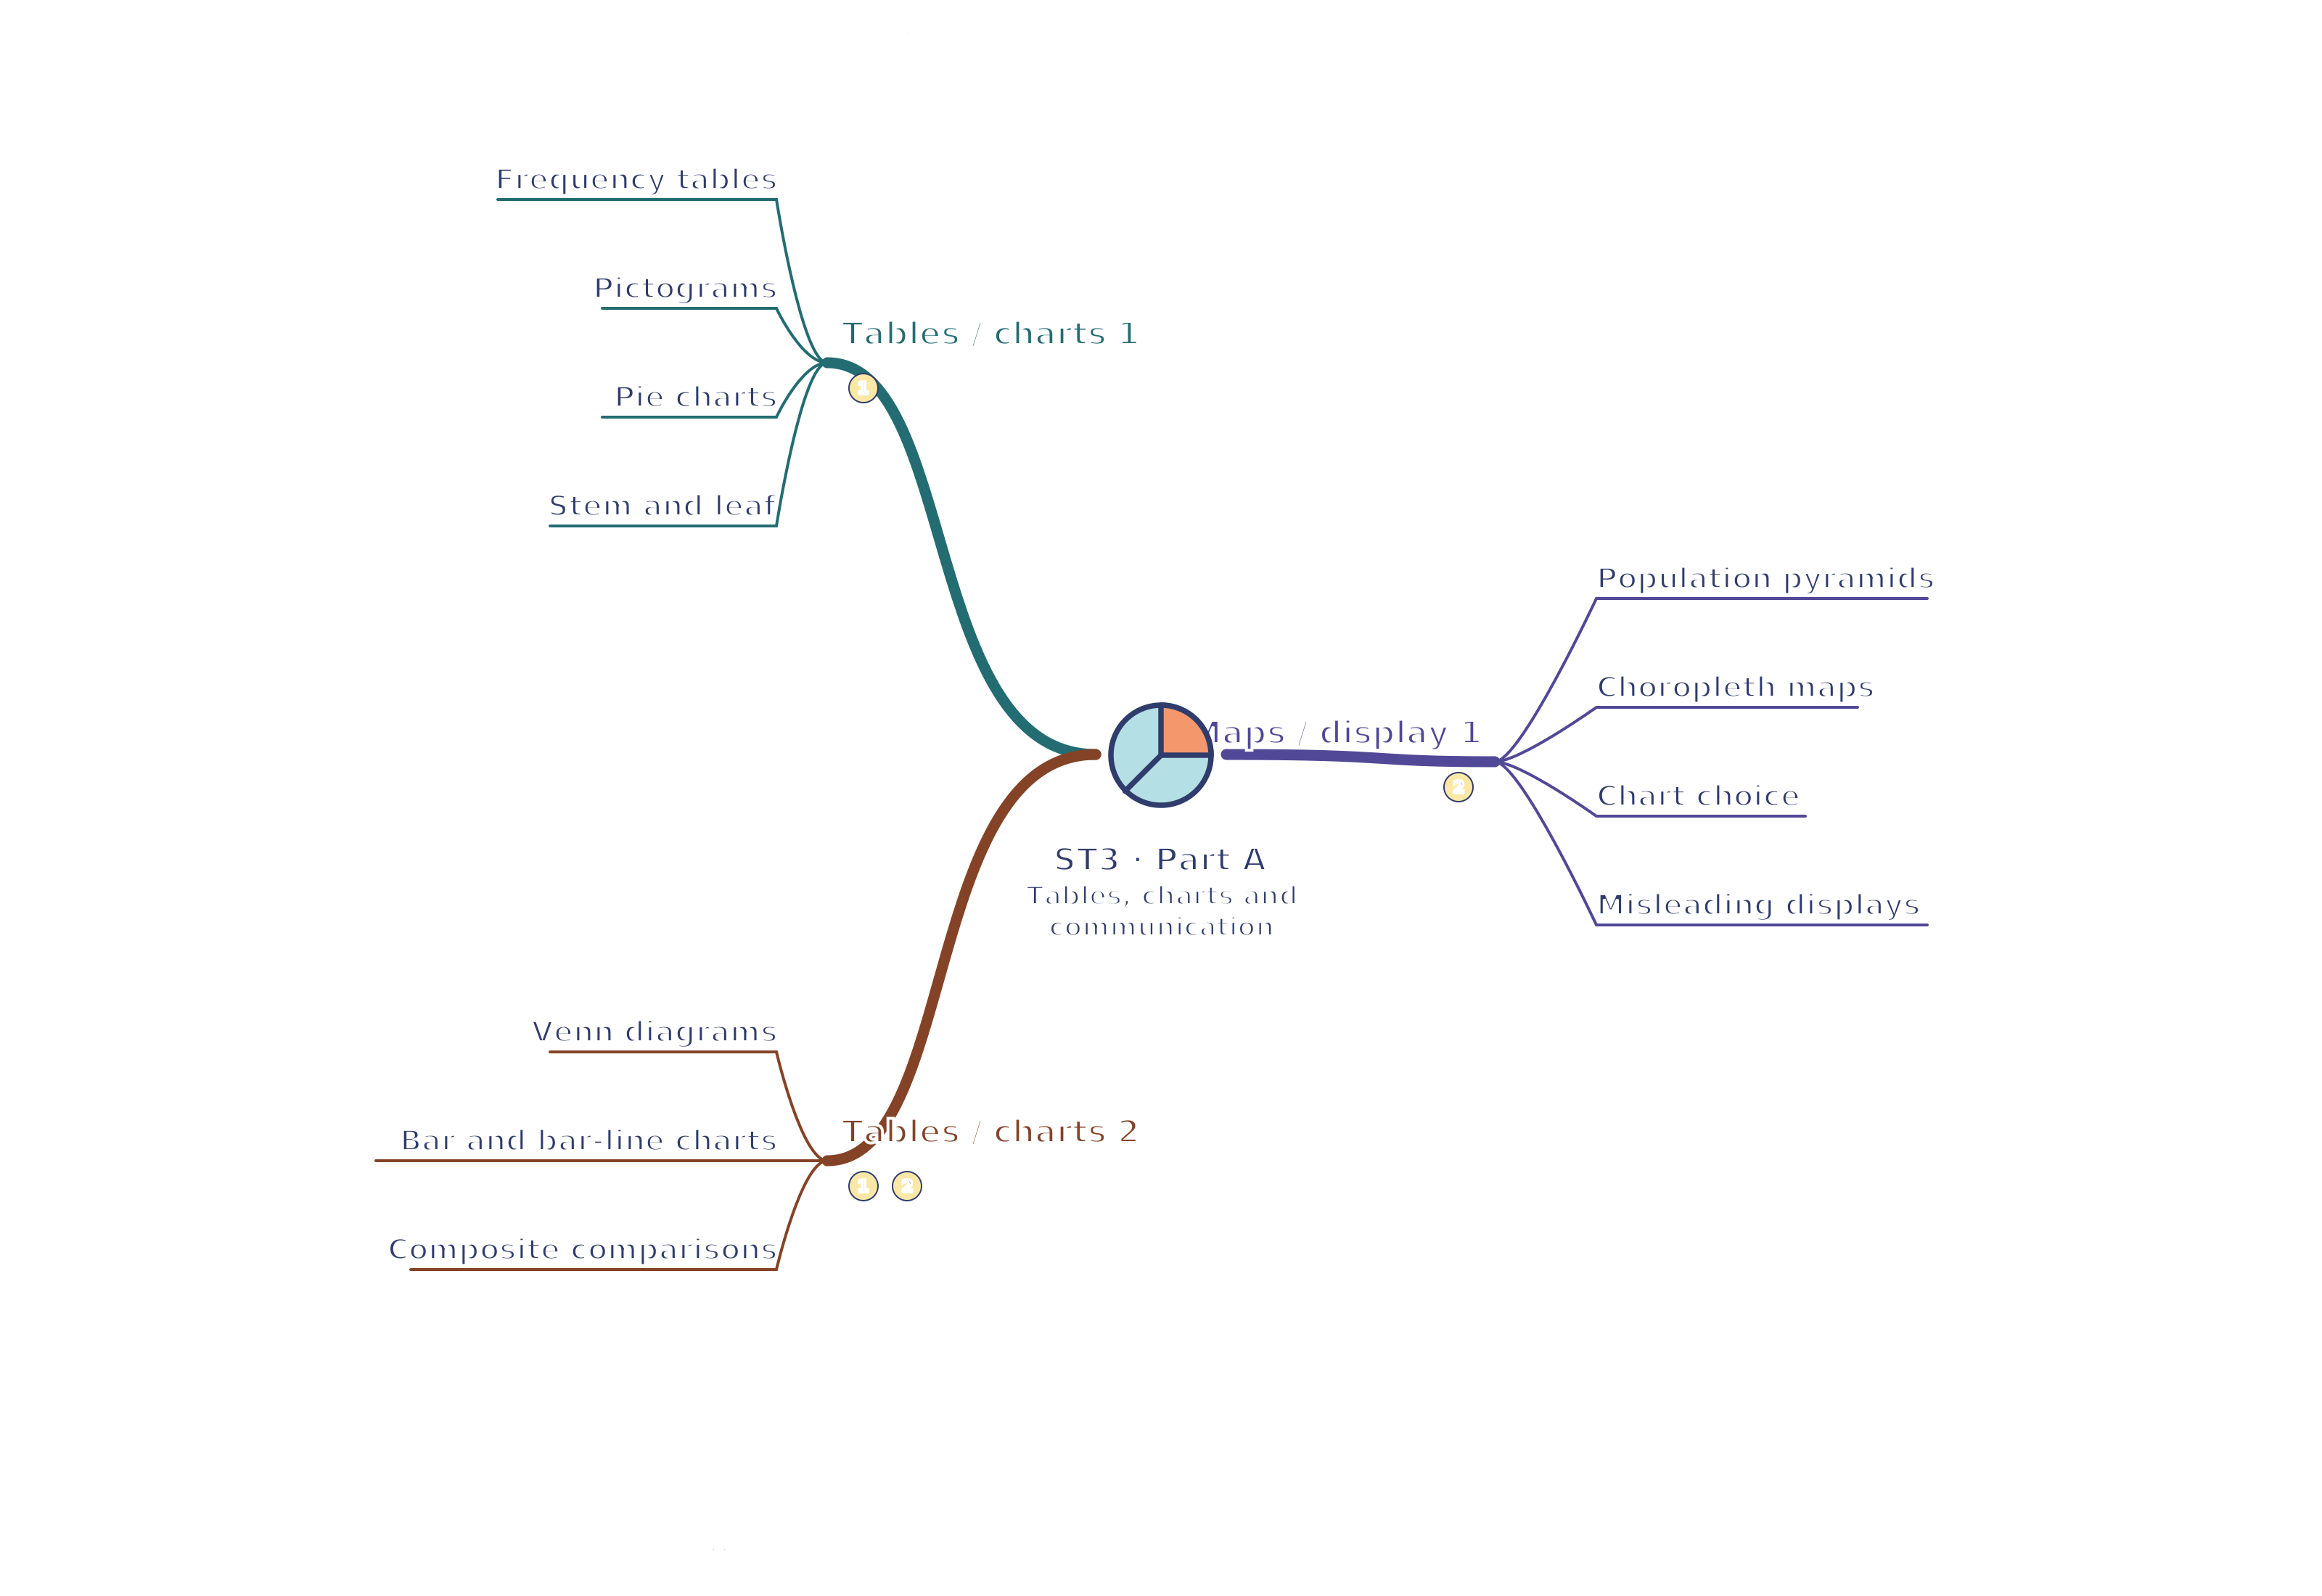
- Frequency tables — A tally records each occurrence and a frequency is its count. Check the sum against the sample size. Relative frequency divides a count by the total; proportions sum to 1 when categories are exhaustive and exclusive: they cover every possibility with no overlap. A two-way table crosses two classifications and needs consistent row, column and grand totals.
- Pictograms — State a key for the value represented by one symbol. If one symbol means four customers, half a symbol means two. Use identical symbol size and sensible fractions rather than enlarging one icon to suggest a greater frequency.
- Pie charts — For exclusive categories covering the whole, sector angle = frequency / total × 360°. A category of 15 out of 60 has angle 90°. Compare proportions on equal-size charts; their sector angles do not by themselves show differences in total populations.
A quarter of a pie represents 15 of 60. Original illustrative diagram; numerical datasets are fictional worked examples. Enlarge diagram - Stem and leaf — Split values into stems and leaves, order leaves within stems and give a key, such as 2 | 7 means 27 minutes. Repeated leaves retain repeated observations. Back-to-back displays compare two groups with a shared stem and keys; exact values remain readable.
In this key, stem 2 represents 20 and leaf 7 represents 7. In a back-to-back display, put one group on each side of the common stem.

- Venn diagrams — A rectangle represents the universal set (all items under consideration), circles represent categories and overlaps represent items in both. Put each count in exactly one region, including outside the circles. The total for A includes its overlap with B; do not count that overlap twice in A or B.
- Bar and bar-line charts — Bars compare categorical frequencies with equal bar widths and separated categories; bar-line charts use narrow vertical lines for discrete numerical values. Label categories or values, frequency, units and scale. Join ordered time observations only when the connection has a meaningful interpretation.
- Composite comparisons — Multiple bars compare groups beside one another; composite bars stack category frequencies. Percentage composite bars each total 100%, comparing the category shares while hiding different totals. Choose a legend and consistent order, and state the original totals when absolute size matters.
Maps, audiences and fair displays
- Population pyramids — A pyramid uses age bands vertically and two population groups on opposite sides, often sexes. Check whether bars show counts or percentages and whether the horizontal scale is symmetric (using the same intervals on both sides). Compare widths for the same age band; different population totals affect count comparisons.

- Choropleth maps — Shading shows a value for each region using a legend with defined intervals. Rates or proportions often make comparisons fairer than raw totals when region populations differ. A large shaded area is not necessarily a large population; boundaries can hide local variation.
For example, 40 out of 400 homes is 10%, while 20 out of 100 homes is 20%. The first region has more homes in the category but a smaller proportion.
- Chart choice — Use a pie chart for composition, bars for categories, a scatter diagram for paired measurements and a histogram for grouped continuous values. Consider the audience and purpose. A spreadsheet's suggested chart is only a starting point; check whether it preserves the meaning of the data.
- Misleading displays — A truncated bar-chart axis can exaggerate differences because bar length represents frequency; label any break clearly. Unequal scale intervals, omitted categories, disproportionate pictures and 3D perspective distort comparisons. Check numbers and denominators rather than judging visual impact alone.

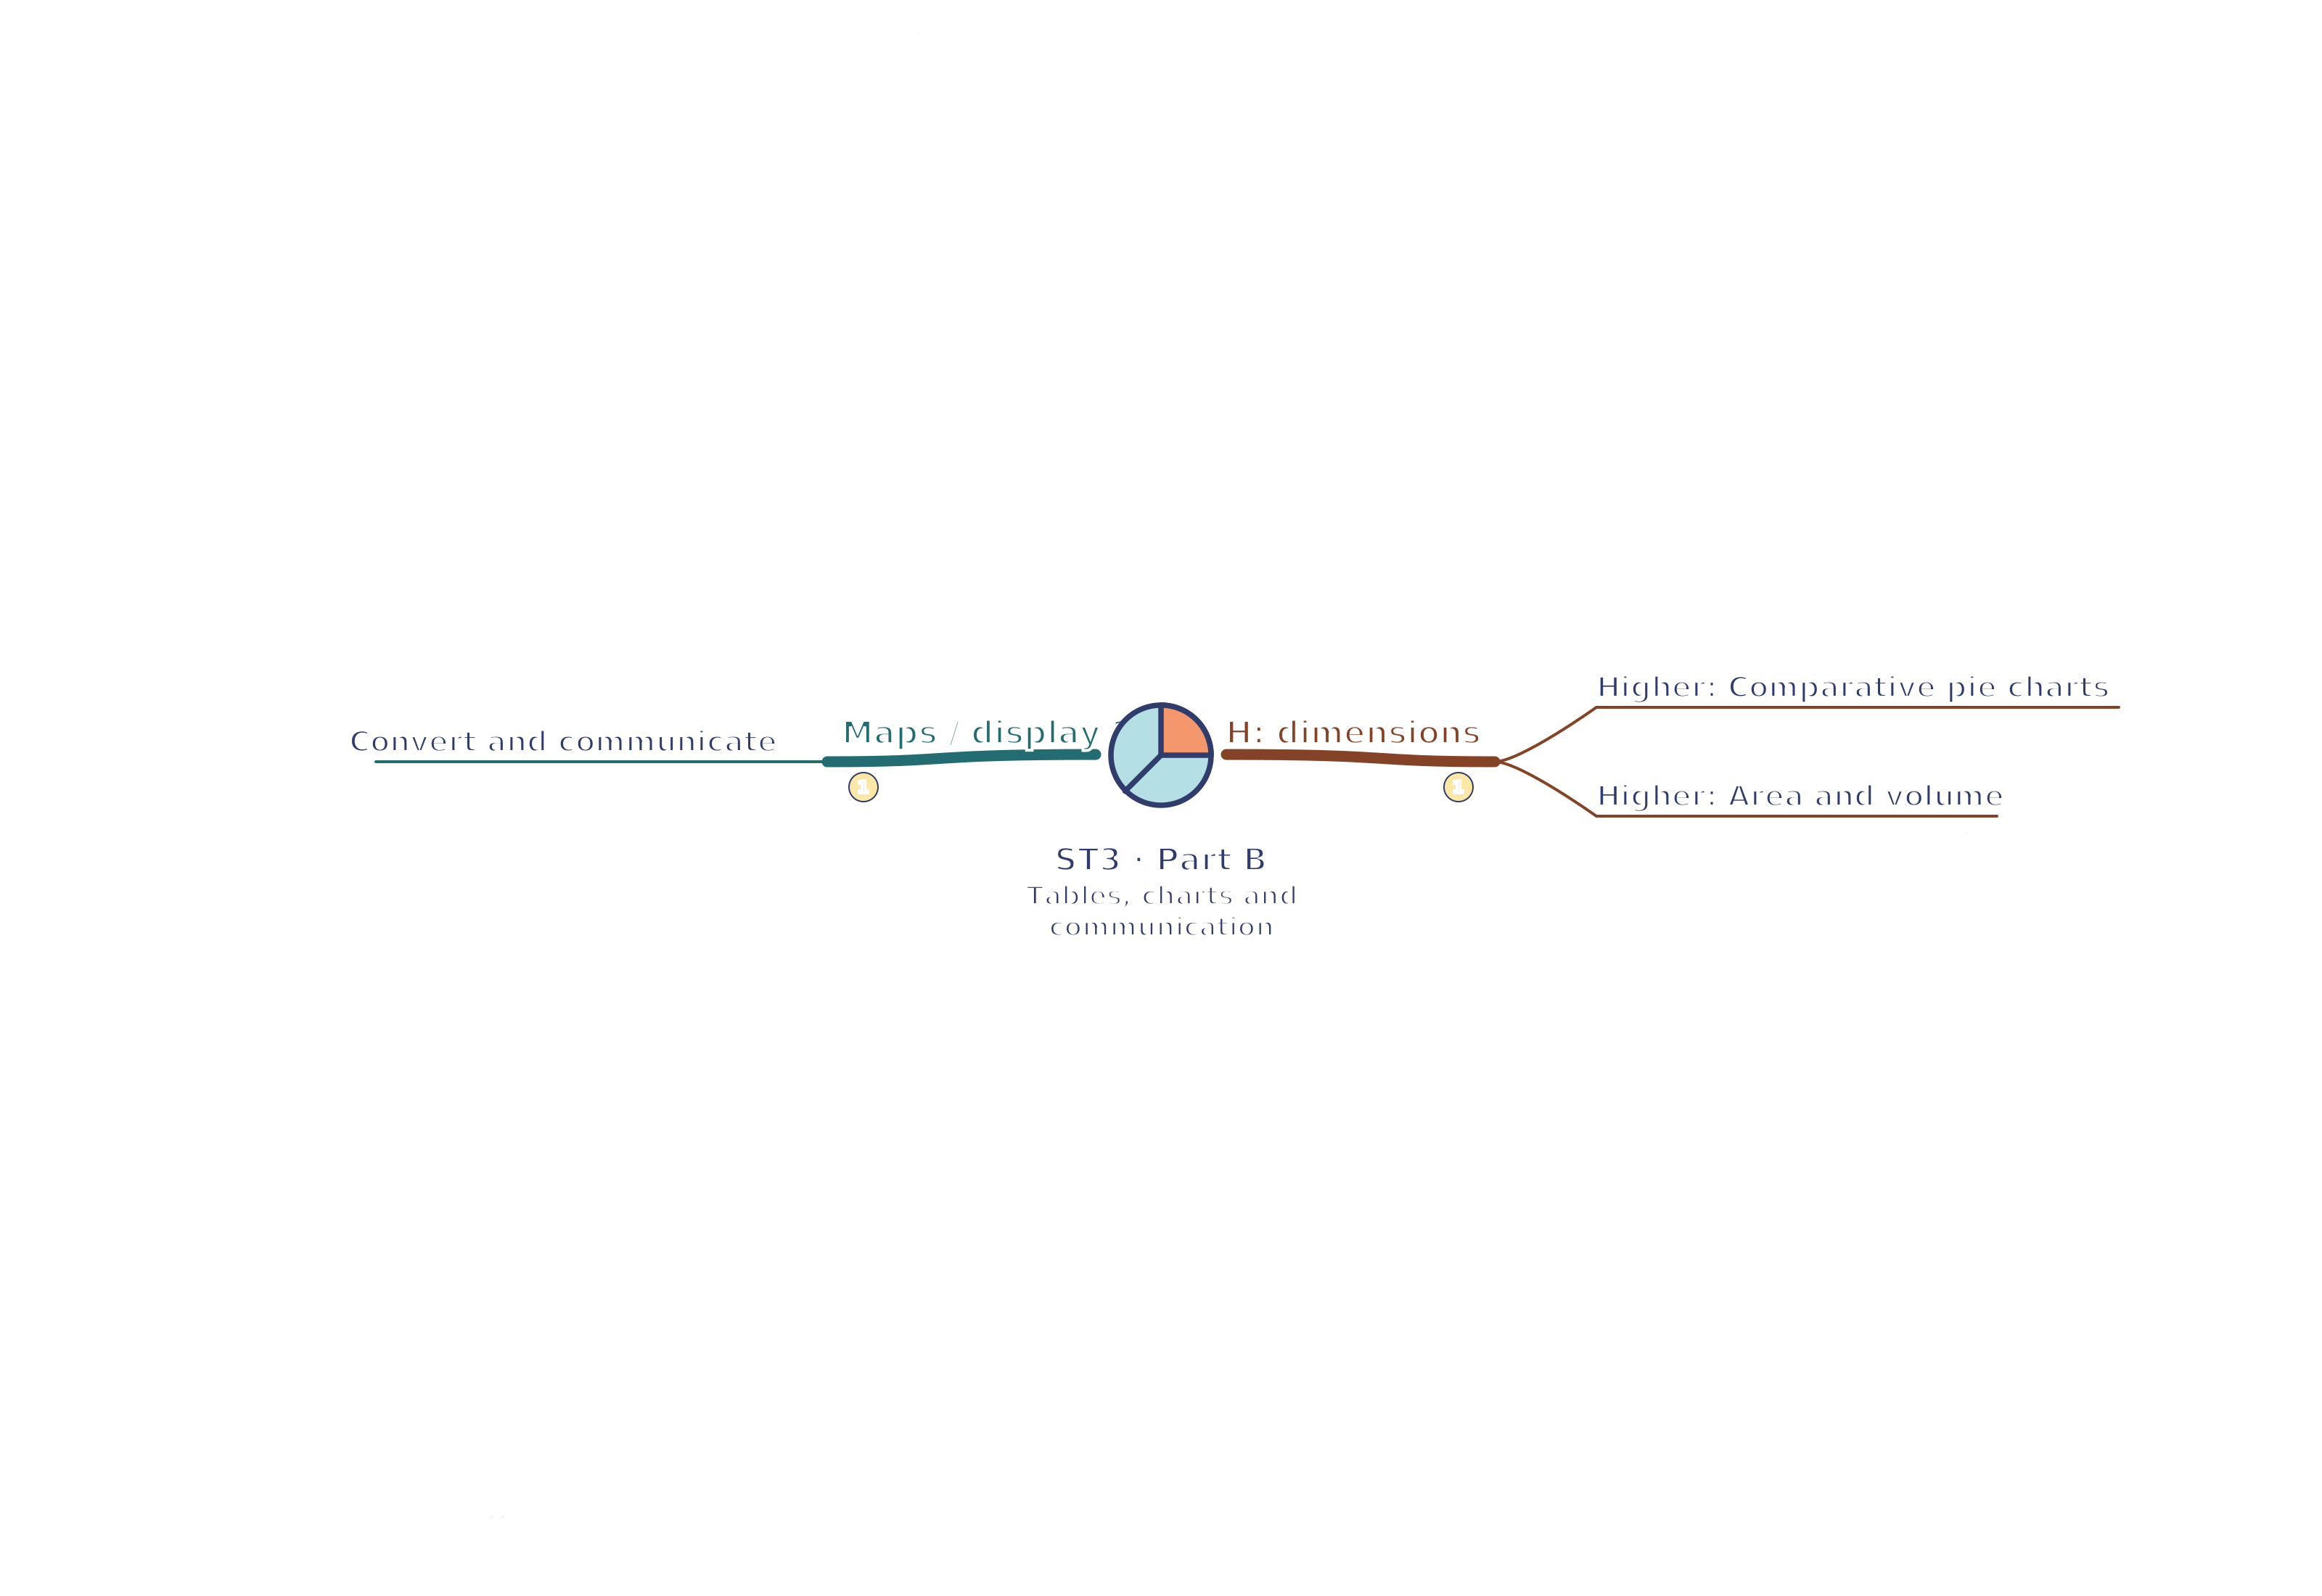
- Convert and communicate — Translate between counts, percentages and displays using the same total. State source, date, population, sample size and units beside the result. A 25% slice in a sample of 80 means 20 observations; percentages from different totals require separate count calculations.
Higher — comparative dimensions
- Comparative pie charts — To show totals as well as proportions, make whole circle areas proportional to totals. Since area = πr², a population four times as large needs twice the radius, not four times. Then sector proportions within each circle show its composition.
- Area and volume — For geometrically similar 2D pictures, frequency ratio equals the square of the linear scale factor; for similar 3D objects it equals the cube. A doubled height and width gives four times the area. Perspective and decorative pictures can obscure the intended scale, so include values and a clear key.