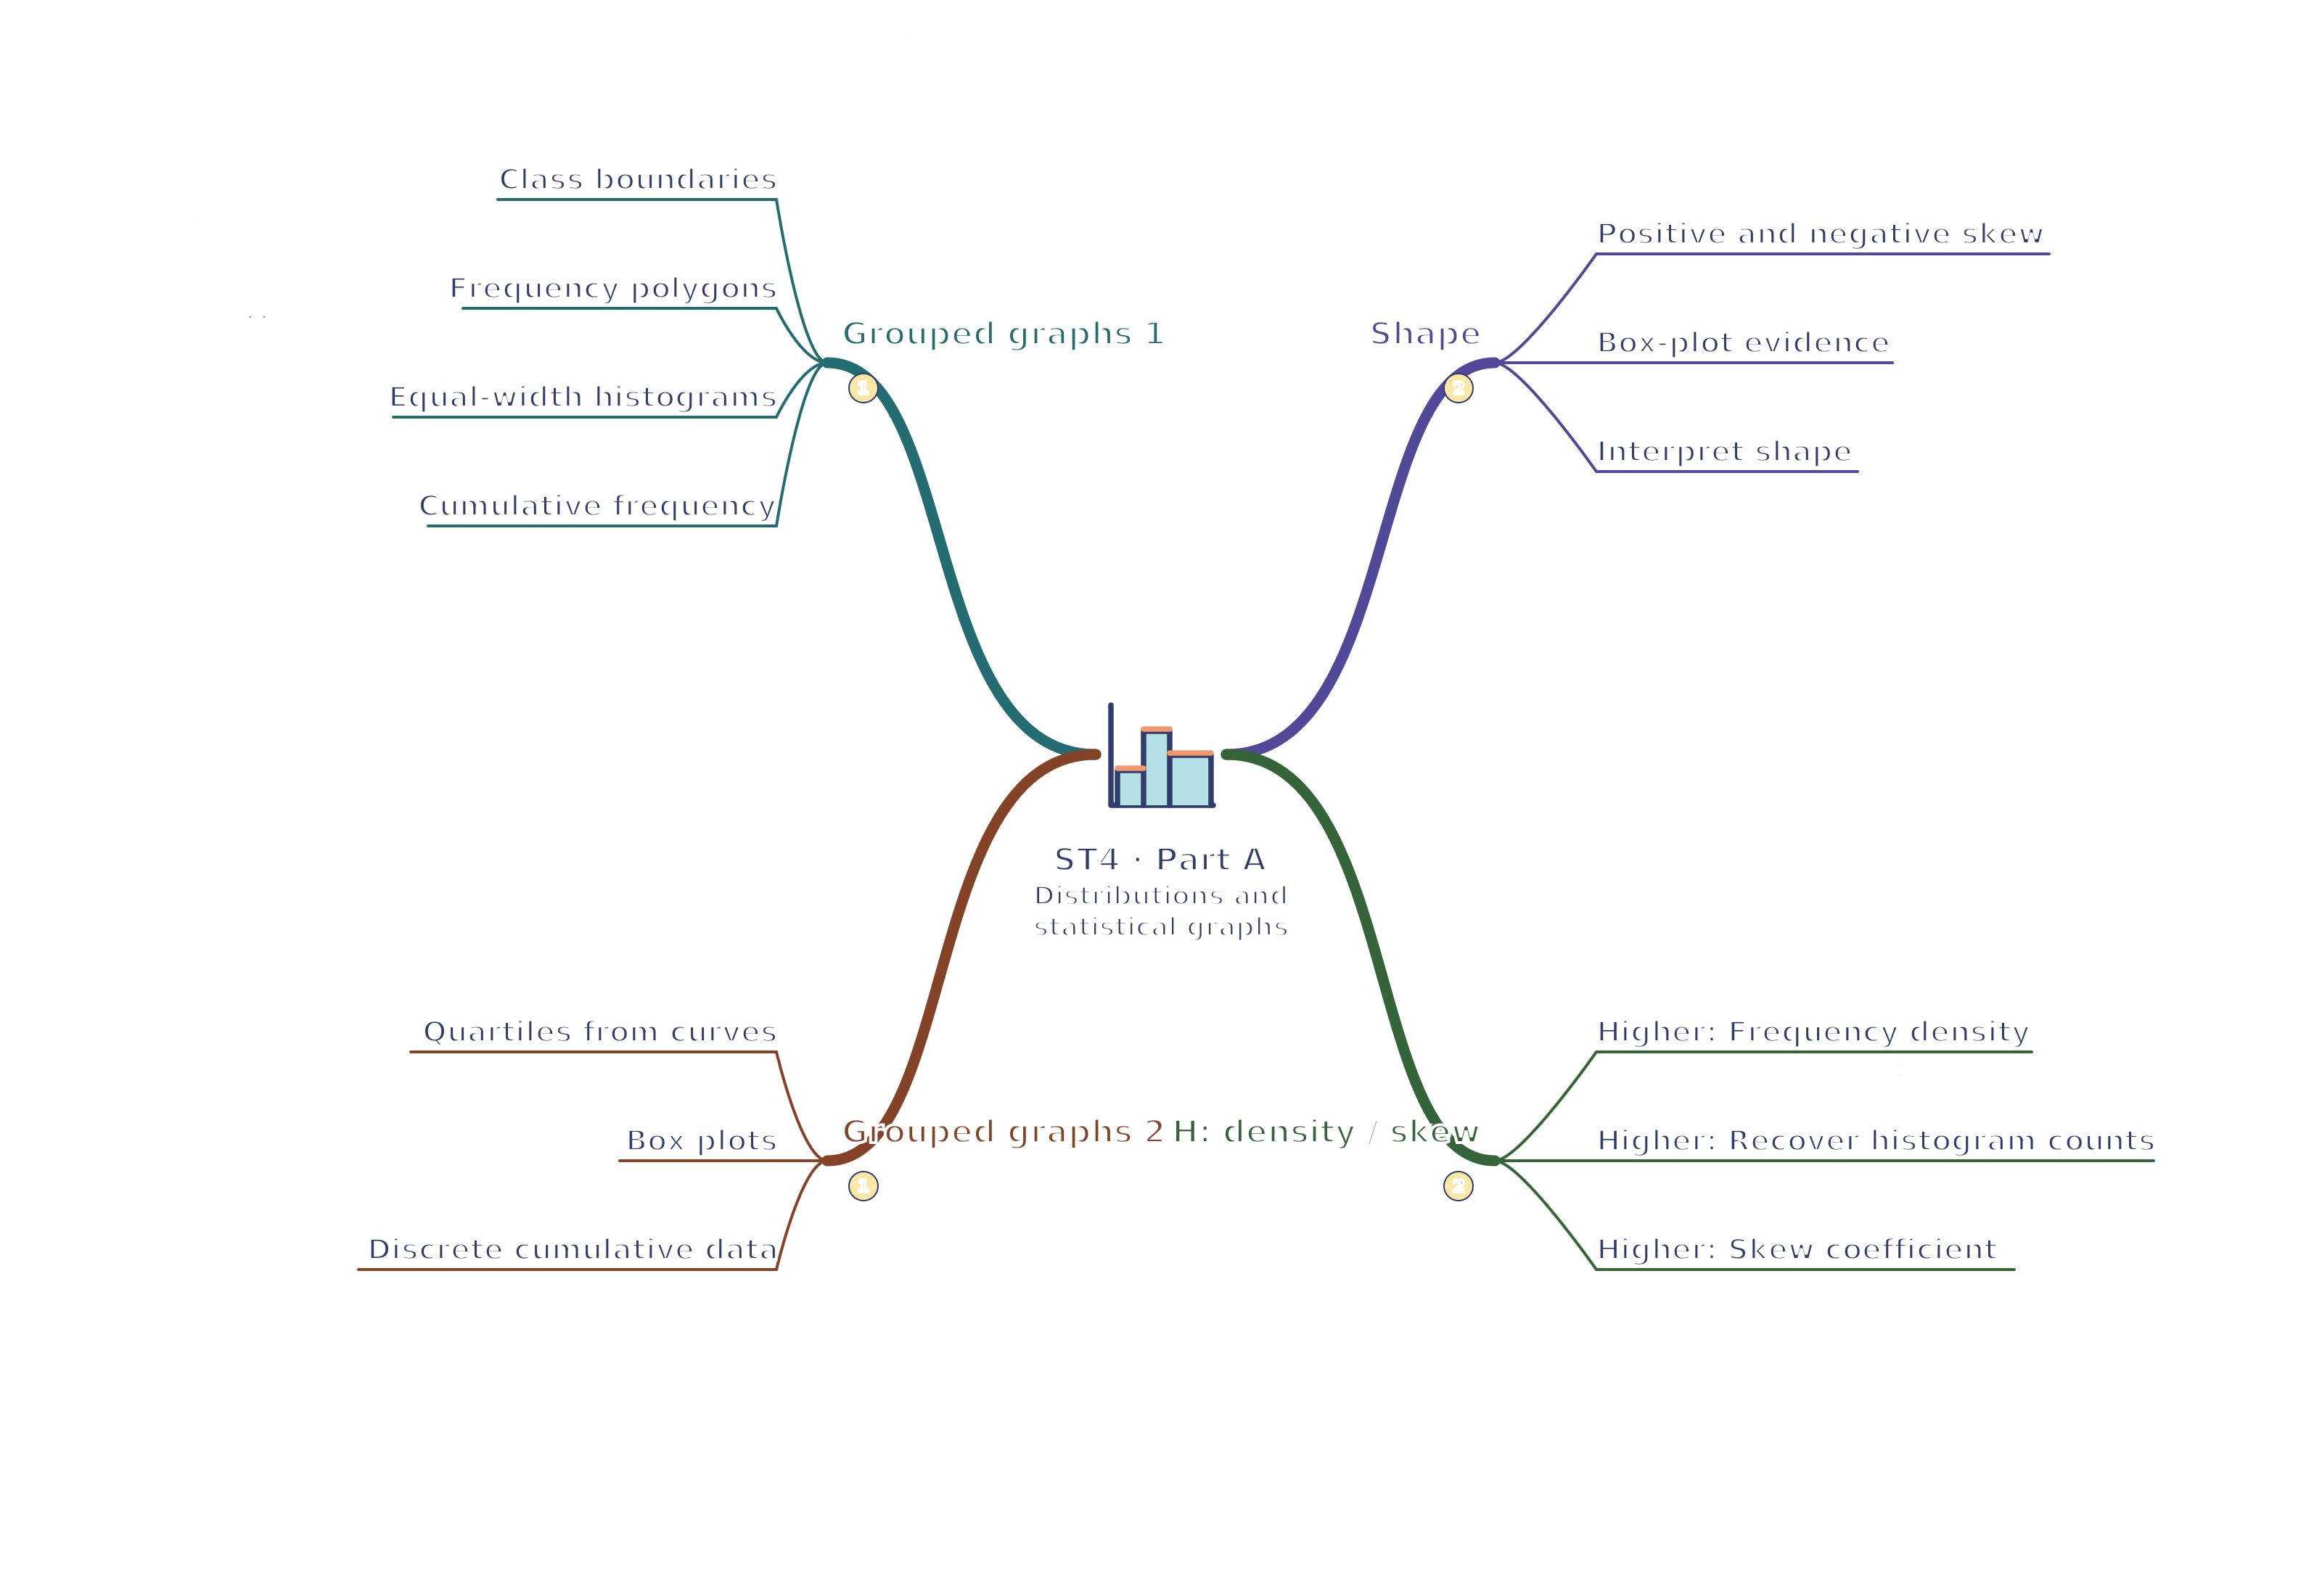
ST4 · Grouped graphs 1 / Grouped graphs 2 / Shape / H: density / skew Distributions and statistical graphs mind map
Use your browser’s Print command for A4 landscape, or choose A3 in its paper settings. The SVG remains sharp when enlarged. A text version follows the map.
Read the mind map as text
Grouped graphs 1
Class boundaries: Boundaries depend on recording precision.
Frequency polygons: Midpoints on x, class frequencies on y.
Equal-width histograms: Touching intervals; equal widths allow frequency heights.
Cumulative frequency: Running totals at upper class boundaries.
Grouped graphs 2
Quartiles from curves: Read quartiles at quarter, half, three-quarter totals.