Reading a map critically — Read title, date, scale, key, orientation and source before drawing a conclusion. Topographical maps show features such as relief and routes; thematic maps emphasise a particular variable. Symbols represent selected information and can be larger than the real feature. A map's omissions and classification choices affect what it appears to show.
Four-figure grid references — On a suitable OS map, read eastings first and northings second to identify a grid square using its lower-left corner. A fictional square whose left easting is 23 and bottom northing is 47 has reference 2347, within the stated grid-letter context. A four-figure reference identifies a square rather than a precise point, so include the relevant map and grid letters where needed.
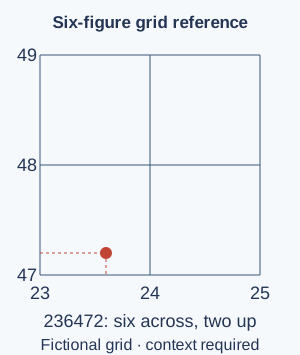
Six-figure grid references — Estimate tenths across and up within the square, keeping all easting digits before all northing digits. In square 2347, a point six tenths across and two tenths up is 236472 in the same stated grid context. This identifies a smaller area, commonly a 100 m square on the National Grid, not a mathematically exact location without uncertainty.Fictional grid example: eastings first, then northings. Six tenths across and two tenths up within square 2347 gives 236472 in the stated grid context. The reference identifies an area rather than an exact point. Full-size diagram
Scale and distance — At 1:25,000, one centimetre on the map represents 25,000 cm, or 250 m, on the ground. A straight 4 cm map distance therefore represents 1 km. A winding route can be longer than the straight-line distance, and slopes can add travel difficulty. Measure using the actual printed or displayed scale; resizing can invalidate a ratio unless accounted for.
Contours and relief — Contours join points of equal elevation. Close spacing commonly indicates a steeper slope, while wider spacing indicates gentler relief, using the stated contour interval. Valley shapes and hill patterns help interpretation when combined with drainage and spot heights. A contour is not a wall on the ground, and its exact meaning depends on the map’s units and datum, the reference level from which heights are measured.
Photographs and remote sensing — Ground, aerial and satellite images show different perspectives and levels of detail. Compare date, season, scale and visible conditions, using maps to locate features. A false-colour image may display information differently from ordinary vision and needs a key. Apparent change can result from shadow, tide or sensor resolution as well as actual land-use change.
GIS and combining information
GIS layers and attributes — A Geographical Information System links location with data so layers can be viewed and analysed together. A school enquiry might combine paths, land cover and measured temperatures. Attributes are stored details about a feature, such as a site’s surface type or measured temperature. Geometry records its location and shape, such as a point for a measurement site or an outline for a playing field. Simply looking at a digital map is not the same as analysing relationships among layers.GIS combines locations and attributes for analysis. These fictional layer categories could support a school temperature enquiry; overlap requires investigation and does not establish causation. Full-size diagram
Spatial analysis — Use an appropriate GIS operation to answer a question, such as comparing measured temperatures by surface type or identifying services within a stated distance of a route. Check coordinate systems, units, dates and missing values. A visual overlap suggests a relationship to investigate, not necessarily a causal explanation; inaccurate input data can produce misleadingly precise-looking output.
Communicating maps — Choose symbols, categories, colour, labels and a legend suited to the audience and variable. A choropleth map shades areas according to a value, such as the percentage of homes with internet access. It often suits rates or proportions by area, while raw totals can be strongly affected by population or area size. Include source and date and avoid colour choices that hide important distinctions. Explain classification boundaries rather than presenting them as natural divisions.
Planning contrasting fieldwork
An enquiry question — A useful geographical enquiry asks about a relationship or difference that can be investigated in approved locations. 'How do surface type and shade relate to temperature at two school sites?' connects processes with measurable evidence. State a prediction based on reasoning and consider alternatives. The prediction is not a result and should not determine which observations are retained.
Contrasting locations — Choose at least two appropriate contrasting locations or settings relevant to the question, such as exposed paved ground and sheltered vegetation. Explain how the contrast helps investigate a process while noting other differences. Routine map use and safe observations in the field should support classroom learning. The school must approve actual locations, access, supervision and risk arrangements.
Methods and sampling — Choose suitable observations, measurements, counts or questionnaires and explain where, when and how often they will be collected. Systematic sampling uses a regular pattern, such as measuring every 10 metres. Random sampling uses chance to choose sites from an agreed area. Stratified sampling takes samples from defined groups, such as paved and planted sites, so both are represented. Each method has limits. Repeated measurements can reveal variation, but a large dataset is not automatically unbiased. Use consistent units and record enough method detail for a fair comparison.
Safety, ethics and inclusion — Identify hazards, likelihood and seriousness, agree controls and follow school supervision and safeguarding rules. Consider access needs, weather, road or water risks, consent and privacy. Do not enter unsafe water, unstable slopes or private land to obtain data. Ethical fieldwork protects people and places and does not pressure residents to disclose personal information.
Recording actual evidence — Use clear field sheets, units, timestamps and suitable location references, with maps, photographs or sketches where authorised. Record unexpected and missing values honestly and explain a repeat or correction. Never fill a gap with an invented observation. Distinguish real pupil data from any fictional worked dataset used to practise analysis.
Analysis and conclusions
Presenting data appropriately — Choose maps, tables and graphs that answer the question, label units and retain relevant variation. A mean summarises values but can hide spread or an outlier; compare it with the actual pattern. For fictional temperatures 16, 18 and 20°C, the mean is 18°C and range 4°C. State sample size and the period represented.
Relationships and explanation — A scatter graph can help investigate association between two numeric variables. A positive pattern means that as one measured value increases, the other tends to increase too. For example, sites with more paving might have higher temperatures. This does not establish that one directly caused the other; shade, time or another factor may contribute. Combine numerical patterns with mapped context and physical or human process understanding. Do not force a straight-line explanation when the data do not support one.
Drawing a supported conclusion — Answer the original question using specific findings, compare contrasting sites and explain relevant processes and exceptions. Separate what the evidence shows from what you infer. A small local enquiry can support a local conclusion without representing an entire city or climate zone. State uncertainty and identify what further evidence would strengthen the explanation.
Evaluation and wider application
Evaluating method quality — Consider representativeness, measurement consistency, equipment, timing, sample size and other variables. Explain how a limitation could affect a conclusion rather than just listing 'human error'. Propose a practical improvement linked to that effect. More measurements are useful only if their design addresses the actual weakness.
Triangulating sources — Compare field observations with maps, aerial imagery, suitable statistics and published explanations, checking dates and scales. Agreement can strengthen a conclusion, while disagreement may reveal different methods or real change. Several sources copying one dataset are not independent confirmation. Discuss the evidence rather than silently choosing the version that matches the prediction.
Communicating geographical judgement — Present a clear extended explanation using location, evidence, processes and a reasoned judgement, with appropriate maps and quantitative work. Address a relevant alternative view and limitations and credit sources. Practical GIS and fieldwork capability require actual work and teacher assessment; a terminology quiz alone cannot establish them.
Test yourself
50 questions · Random sets of 10. These quick checks support revision; practise longer explanations and justified judgements too.
Mind map
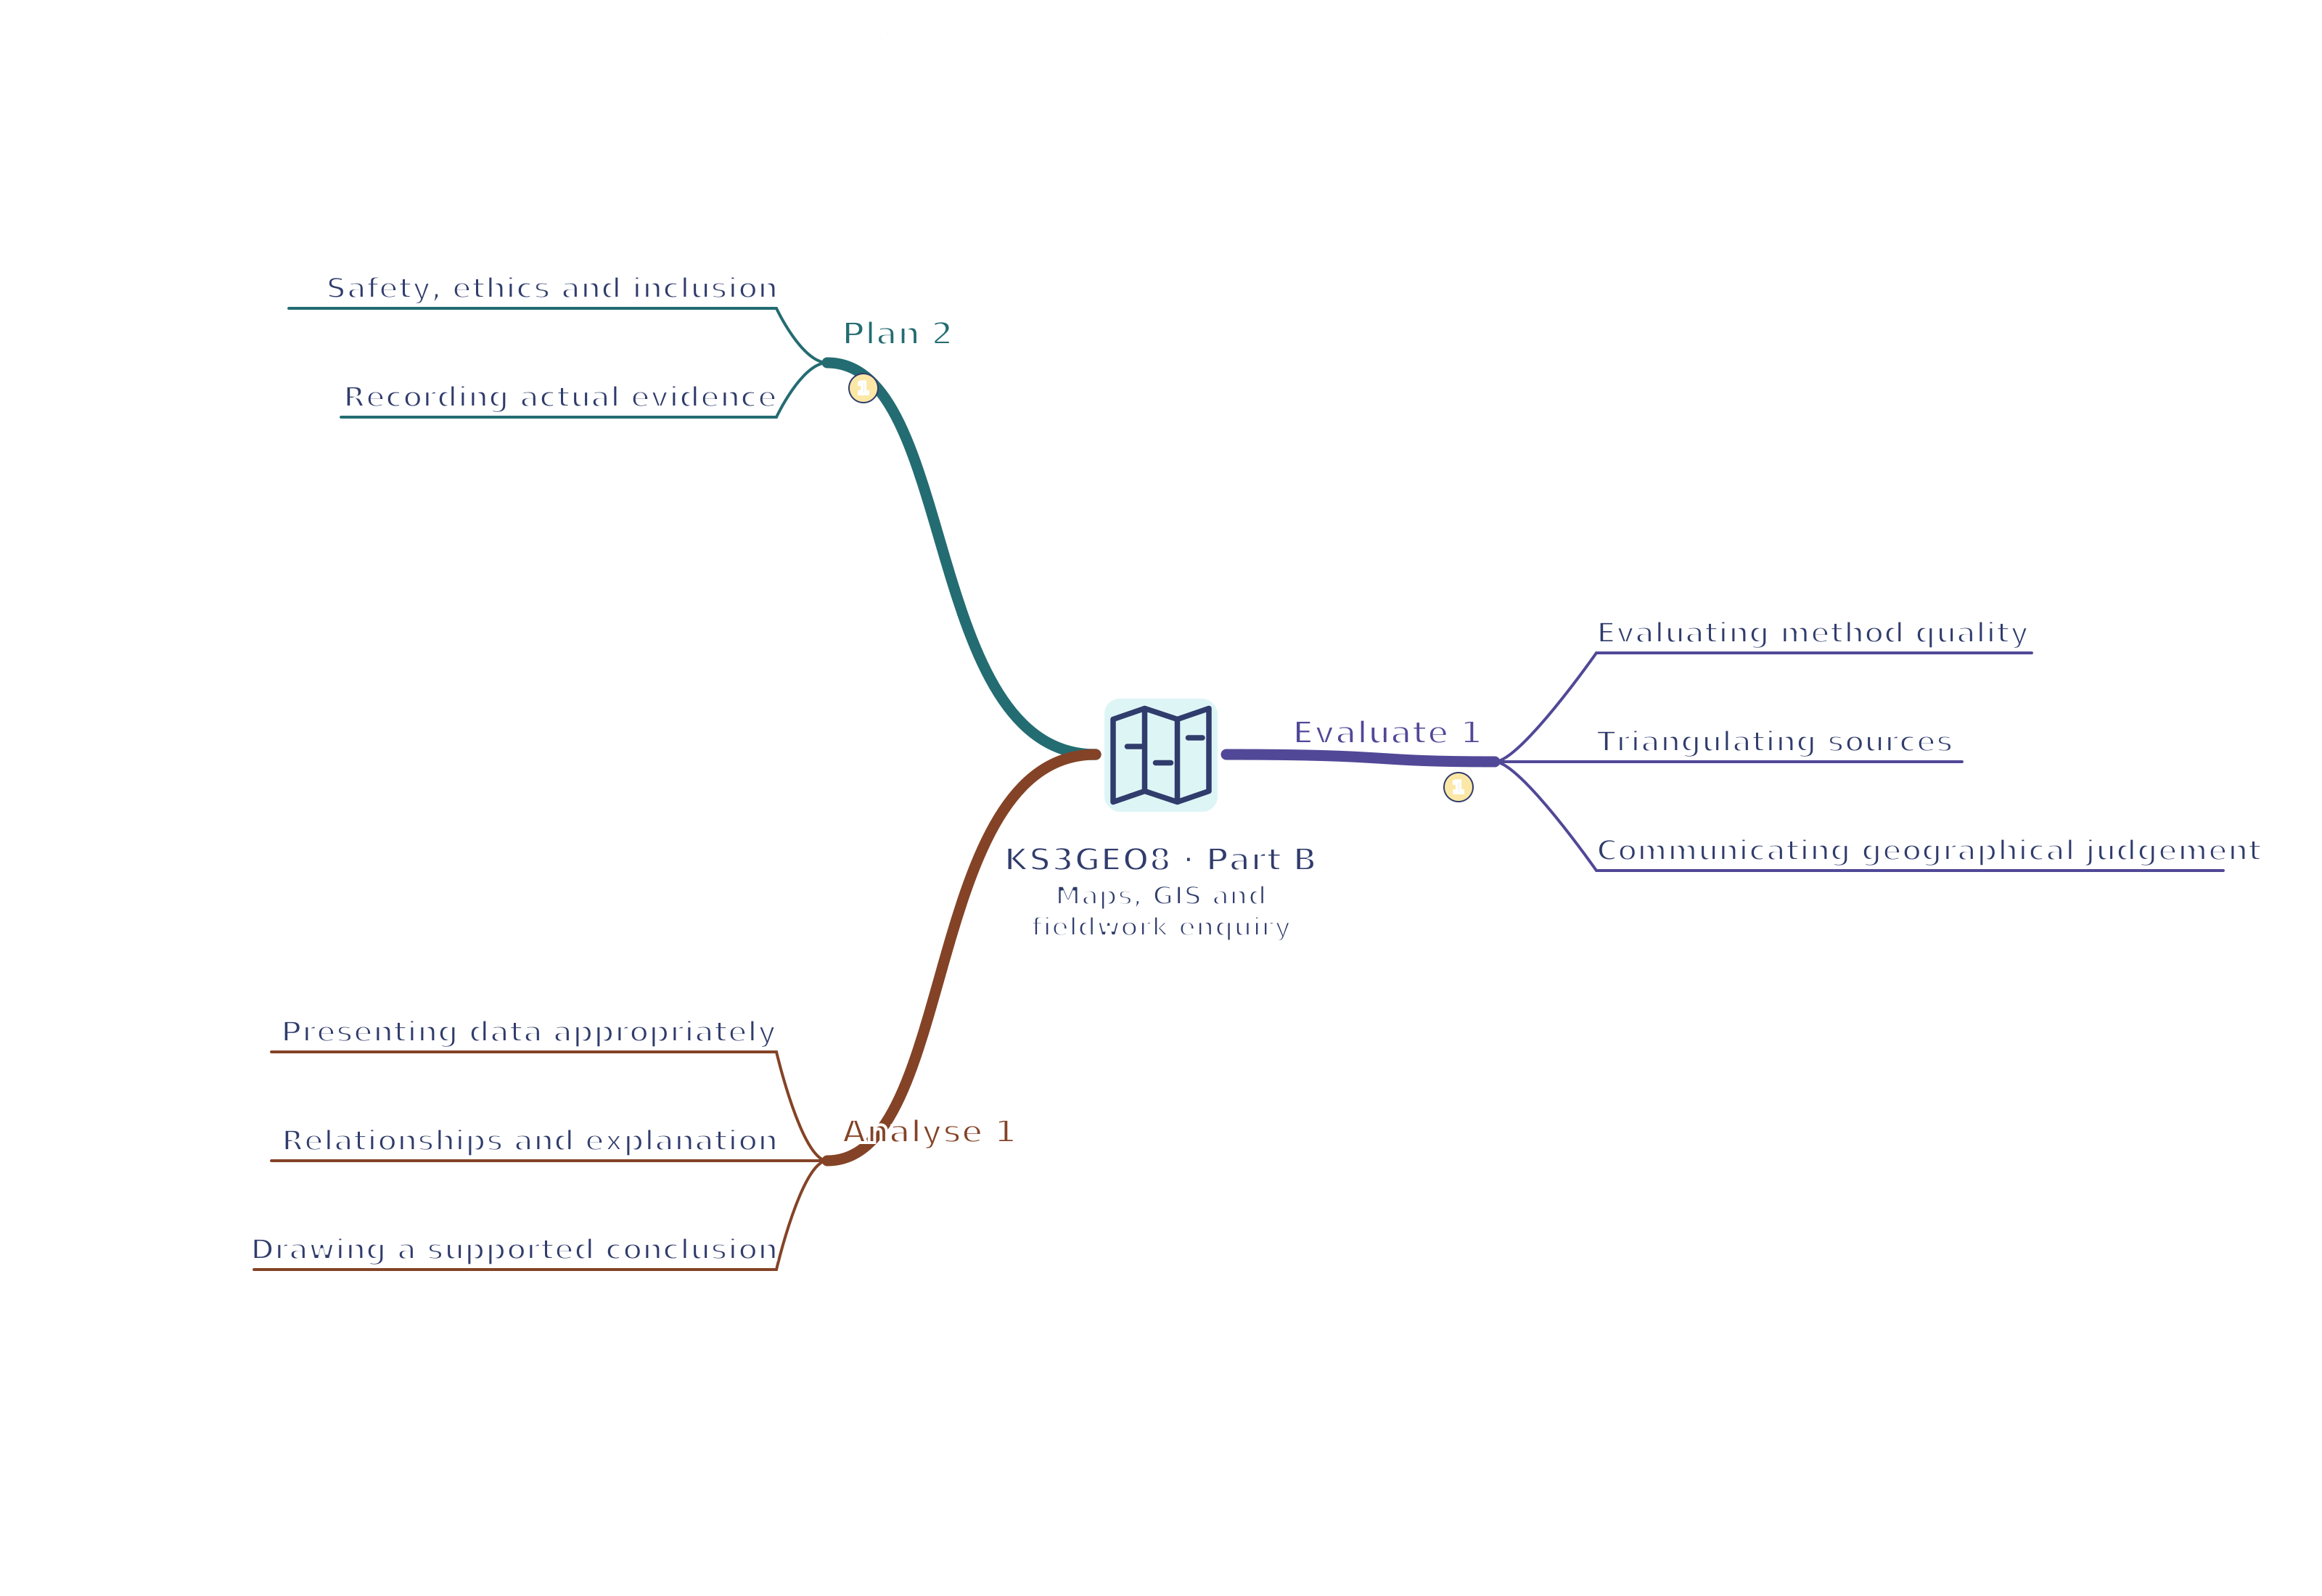
Use the branches to recall the ideas and explain their connections. Check the revision notes for the full detail.
KS3GEO8 · 1
View KS3GEO8 · 1 mind mapOpen the full-size map to zoom. Use the printable view for A4 landscape or enlarge to A3.
 Mr Kidman's Classroom