 Mr Kidman's Classroom


Revise the key ideas
Molecular ions, fragments and accurate mass
- Mass-to-charge reading — A mass spectrum plots relative ion abundance against mass-to-charge ratio m/z. For a singly charged positive ion, m/z is numerically its relative ionic mass in the course approximation. A doubly charged ion appears at half the corresponding mass value; a neutral fragment is not directly detected as an ion peak.
- Molecular versus base peak — A molecular ion can form when an electron is removed without breaking the molecule; its m/z can reveal relative molecular mass for charge +1. The base peak is the most abundant ion, scaled to 100%, and may be a fragment rather than the molecular ion. A weak or absent molecular-ion signal requires caution rather than assigning the tallest peak as the mass automatically.
- Fragment conservation — Fragmentation can produce a charged fragment and a neutral radical or molecule. Track total atoms, charge and lost mass using a chemically plausible pathway. A suggested fragment formula must fit the parent composition; writing a common ion that contains an element absent from the proposed molecule is impossible.
- Useful fragment patterns — An ethyl cation C2H5+ has nominal m/z 29, while CHO+ also has nominal 29. An acylium-type CH3CO+ fragment can give nominal 43, but C3H7+ also gives 43. Such peaks suggest possibilities rather than unique structures; combine the molecular ion, other fragments and complementary evidence.
- Mass differences and neutral loss — If a parent nominal m/z 60 produces an ion at 42, a difference of 18 can suggest water loss when the parent structure and conditions permit it. The arithmetic alone does not prove water because different composition possibilities may share a nominal loss. State both the proposed lost species and the remaining ion formula.
- Isotope patterns — A chlorine-containing ion commonly shows M and M+2 contributions in roughly 3:1 for one Cl, while one Br gives roughly 1:1 under the usual isotope-abundance approximation. Two halogens give combination patterns rather than the same single-atom ratio. Distinguish an isotope peak from a fragment and relate each pattern to the relevant ion's composition.
- Accurate mass calculation — Sum the supplied precise isotope relative masses with each atom coefficient. Using C = 12.0000, H = 1.0078 and O = 15.9949, C2H6O has accurate relative mass 46.0417 while CH2O2 has 46.0054. Both have nominal mass 46, but a sufficiently resolving measurement can distinguish these formulas under the stated charge convention.
- Candidate formula checks — Given a sufficiently accurate mass and elemental possibilities, calculate candidate values and compare with the stated measurement tolerance. Check valency, isotope evidence and plausible structures as well. More decimal places printed in a result do not prove the instrument's accuracy or uniquely distinguish structural isomers sharing one molecular formula.
Infrared evidence and functional groups
- Infrared absorption — Molecules absorb suitable infrared frequencies when vibrations produce an appropriate changing dipole. An IR spectrum can therefore indicate functional groups through absorption positions and shapes. It does not directly draw the carbon skeleton, and a missing weak feature is not always secure evidence that a bond is absent.
- Wavenumber axes — Wavenumber is the reciprocal of wavelength, so a higher wavenumber means a shorter wavelength and higher frequency. IR commonly uses wavenumber in cm−1, often displayed decreasing from left to right. A transmission trace dips at absorption, while an absorbance trace rises. Check the actual axis and representation before calling every downward feature a loss of concentration or comparing widths between differently scaled spectra.
- Using supplied reference data — Compare a measured feature with the supplied wavenumber range and relevant shape, considering other plausible groups and overlapping bands. Typical values support interpretation but depend on environment and conditions; the examination data table should guide numerical assignments rather than an invented exact universal frequency.
Useful course-data examples in cm−1 include alkane C–H 2853–2962, alkene C–H 3010–3095, aldehyde C–H bands 2820–2900 and 2700–2775, isolated C=C 1645–1669, amine N–H 3300–3500, alcohol/phenol O–H 3200–3750 and carboxylic-acid O–H 2500–3300. Saturated alkyl aldehyde C=O is listed at 1720–1740 and alkyl ketone C=O at 1700–1720. These overlapping ranges illustrate why shape and combined evidence matter, and the supplied reference controls the exact assignment.
- OH and carbonyl patterns — An alcohol often gives broad O–H absorption in its suitable stretching region. A carboxylic acid usually combines C=O absorption with a particularly broad O–H region that can overlap C–H absorptions. An aldehyde or ketone gives carbonyl absorption without requiring an O–H group; a single C=O peak does not distinguish all carbonyl families.
- Carbon–hydrogen and alkene evidence — Use C–H stretching and suitable C=C absorption alongside other evidence to assess alkane, alkene or aldehyde possibilities. An alkene band can be weak or affected by symmetry, so its absence alone should not rule out every C=C. Carbon count and proton/carbon NMR can provide stronger connectivity constraints.
- Nitrogen–hydrogen and overlap — Amines can show N–H stretching where N–H bonds are present; a tertiary amine has no N–H bond even though it contains nitrogen. An amide's N–H and carbonyl features differ in context from a simple amine. Use the actual structure and supplied ranges rather than asserting every nitrogen compound has the same absorption.
- Fingerprint comparison — The lower-wavenumber fingerprint region contains many coupled vibrations. A close match to a suitable reference can help identify a known compound, while a functional-group band alone usually narrows a family. Sample purity, state and collection conditions matter; apparent similarity is not automatic proof of identical mixtures.
- Reaction monitoring — Loss of an alcohol O–H feature with development of a carbonyl can support an oxidation, but remaining solvent or water can complicate the trace. Compare before/after spectra and the expected product class and distinguish a detectable remaining starting material from a claim of quantitative conversion. IR evidence does not by itself establish isolated yield.
Carbon-13 NMR environments
- NMR information — NMR means nuclear magnetic resonance. It relates nuclear responses in an applied magnetic field to their chemical environment. The course carbon-13 spectrum distinguishes chemically different carbon environments; it does not give a photograph of atomic positions in space. Chemical equivalence depends on the whole structure and symmetry, not merely the element symbol.
- Counting carbon environments — Equivalent carbons give one carbon-13 signal in the standard simplified interpretation. Propane has two carbon environments because its two end methyl carbons are equivalent and its middle carbon differs. Propan-1-ol has three because the OH end breaks that end-to-end equivalence.
- Symmetry examples — Propanone has two carbon environments: its equivalent methyl carbons and its carbonyl carbon. Benzene has one carbon environment in the ideal unsubstituted molecule. A substituted ring can have several environments even if all six atoms remain aromatic; symmetry must be assessed after adding substituents.
- Chemical shift — Chemical shift δ is reported relative to an appropriate reference in parts per million, ppm. Electrons partly shield a nucleus from the applied magnetic field; different surrounding electron distributions therefore change the field it experiences. Different shielding and bonding environments move signals into characteristic ranges. Downfield means toward a larger chemical-shift value, often drawn to the left. Use supplied data to distinguish alkyl, heteroatom-adjacent, aromatic/alkene and carbonyl environments; the signal position is not the number of carbon atoms present.
As orientation rather than universal cutoffs, many simple alkyl carbons occur in the low tens of ppm, oxygen-bound saturated carbons further downfield, aromatic/alkene carbons roughly in the 100–160 region, and carbonyl carbons still further downfield. For an illustrative spectrum, signals near 30 and 205 ppm with two environments can support the methyl/carbonyl pair in propanone when its formula and other data agree.
- Reference and solvent signals — Tetramethylsilane, TMS, can define the reference near δ = 0; a deuterated solvent, one with much of its hydrogen replaced by the isotope deuterium, helps limit ordinary solvent proton signals and may still show known residual or carbon signals. Identify stated reference/solvent contributions before counting analyte environments. A spectrum's labelled non-analyte peak must not be forced into the molecular formula.
- Carbon-signal limits — Proton decoupling suppresses splitting of carbon signals caused by interactions with attached protons. Ordinary proton-decoupled carbon-13 spectra usually show one signal per resolved carbon environment without the simple proton n+1 splitting used below. Relative intensities are not normally read as direct carbon counts, and weak or overlapping signals may be missed. Combine expected environment number with actual resolution and the stated acquisition context.
Proton NMR shifts, integration and splitting
- Proton environments — Equivalent protons contribute to the same chemical-shift environment in the simple course model. Ethanol commonly shows methyl, methylene and hydroxyl environments, while propanone's six methyl protons are equivalent. More complex molecules can contain non-equivalent hydrogens on one carbon, so do not apply a one-carbon-one-proton-signal rule universally.
- Integration — Relative integrated signal areas give relative numbers of protons under suitable acquisition and interpretation conditions. A 3:2:1 ratio can support methyl:methylene:OH in an appropriate ethanol spectrum. Ratios must be scaled to the molecular formula; a displayed ratio 1:1 need not mean the molecule contains only two hydrogens.
- Simple n+1 rule — For coupling to n equivalent neighbouring protons in the appropriate first-order model, a signal splits into n+1 lines. A methyl next to CH2 can give a triplet (three lines) and CH2 next to CH3 a quartet (four lines). A singlet has one line. Equivalent protons within one set do not split each other in this simple description.
- Line intensity and multiple neighbours — A simple triplet has approximate 1:2:1 line intensities and a quartet 1:3:3:1. Coupling to several non-equivalent sets can produce more complex multiplets rather than a single n+1 pattern based on blindly adding every nearby H. Use only the model and resolution supported by the supplied spectrum.
- OH and NH exchange — OH or NH shifts can vary with solvent, hydrogen bonding, concentration and exchange. Rapid exchange can suppress the simple expected coupling and broaden the signal, so an alcohol OH is often treated as an unsplit exchangeable signal at this level. Do not rely on one universal OH shift or demand ordinary adjacent-proton splitting in every spectrum.
- D2O exchange evidence — Adding suitable D2O can replace exchangeable OH/NH protons with deuterium, reducing or removing their ordinary proton NMR signals. A disappearing signal supports an exchangeable proton under the conditions; it does not count carbon atoms or uniquely distinguish alcohol from every other exchangeable group.
- Worked ethanol interpretation — For C2H6O, a three-proton triplet and two-proton quartet support CH3–CH2, with the CH2 shift consistent with oxygen attachment and a remaining exchangeable proton supporting OH. An ether with the same formula would give a different environment/splitting pattern. Combine formula, area, shifts and coupling rather than identifying ethanol from a triplet alone.
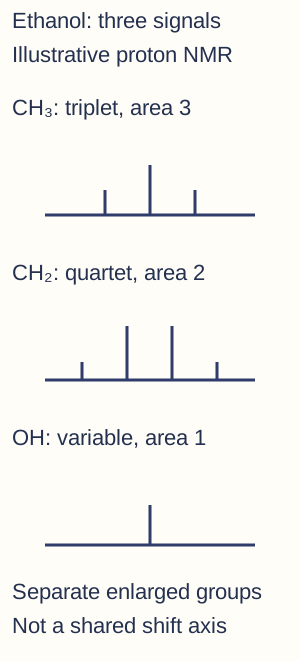
Separate enlarged schematic signal groups for ethanol: methyl triplet, methylene quartet and a variable exchangeable OH signal, with integrated areas 3:2:1 under suitable conditions. Heights illustrate within-multiplet intensity patterns, not area ratios across panels. There is no shared chemical-shift axis; use actual shift data to place each group. OH exchange can change its appearance. - Worked ester interpretation — Ethyl ethanoate commonly has a three-proton singlet from CH3CO–, a two-proton quartet from –OCH2– and a three-proton triplet from its terminal ethyl CH3. The ester carbonyl has no attached proton, and the methyl across C=O is not treated as an ordinary neighbouring H set splitting the ethoxy CH2. Carbon-13 and IR provide complementary carbonyl evidence.
- Aromatic and aldehyde regions — Use supplied shifts to recognise possible aromatic, alkene or aldehyde proton regions. Aromatic coupling can be more complex than a single elementary n+1 rule, and substitution pattern affects equivalence. An aldehyde proton is evidence for –CHO when consistent with carbonyl IR, molecular formula and other signals rather than an isolated unexplained far-downfield line.
Illustrative proton reference positions include propanone near 2.10 ppm, ethene near 5.28 ppm and benzene near 7.27 ppm in the course booklet. Simple aldehyde H often lies around 9–10 ppm, while alkyl, heteroatom-adjacent and exchangeable protons occupy other sometimes overlapping regions. Treat these as reference examples and use the actual supplied ranges and conditions for the unknown.
- Whole-spectrum checks — Count environments, scale total integration, test splitting neighbours and place each shift on the proposed structure. Explain every major analyte signal and preserve atom counts. Accidental overlap, impurities and exchange can require qualified alternatives; a correct fragment assignment does not establish the whole molecule until the remaining data fit.
Thin-layer chromatography and Rf
- Two phases — Chromatography separates mixture components through different distributions or interactions between a mobile phase and a stationary phase. A component with stronger stationary-phase interaction tends to travel less in a given system, while greater affinity for the moving phase can increase travel. Polarity alone is not a universal direction rule without specifying the phases.
- TLC setup — For a suitable thin-layer plate, draw a pencil baseline, apply small concentrated spots and place the plate in a chamber with the baseline above the solvent surface. Ink can itself separate and submerged sample spots may dissolve directly into the reservoir. Choose the solvent and stationary phase for the substances being investigated.
- Developing and locating — Let the solvent rise under the approved conditions, remove the plate before the front reaches the top and mark the solvent front promptly. Locate colourless spots with a suitable approved UV or chemical method; amino acids may use an appropriate locating reagent. A method's visibility and detection limit affect how many spots are observed.
- Rf calculation — Rf = distance travelled by the centre of a component spot from the baseline divided by distance travelled by solvent front from that same baseline. If the distances are 3.20 and 8.00 cm, Rf = 0.400 with no unit. Measuring from the plate bottom or using the top edge of a broad spot gives a different and unjustified value.

Measured-distance example on a schematic TLC plate: both distances start at the pencil origin. The solvent front travels 8.00 cm and the spot centre 3.20 cm, giving dimensionless Rf = 0.400. Plate dimensions are schematic; separation conditions and references still govern identity conclusions. - Rf comparisons and limits — Compare unknowns with standards under the same stationary phase, solvent and conditions. Matching Rf supports a possible identity but different compounds can co-migrate, meaning travel together and give overlapping spots; changing solvent can help separate alternatives. One spot does not prove absolute purity because components may overlap or remain undetected.
Column methods, coupled analysis and evidence
- Gas chromatography — GC uses a gaseous mobile phase through a column with a suitable stationary phase. Compounds must be suitable for volatilisation without unacceptable decomposition. Different interactions and volatility affect retention times, which depend on column, temperature and flow; a retention time is not an inherent number valid on every instrument.
- High-performance liquid chromatography — HPLC drives a liquid mobile phase through an appropriate packed column under pressure. It can analyse suitable less volatile or thermally sensitive substances that are unsuitable for straightforward GC. Stationary/mobile composition, flow and detector settings affect separation and sensitivity, so choose a method for the actual analyte.
- Reading a chromatogram — A detector response plotted against time can show separated peaks with different retention times. Relative peak areas can support amount estimates only with appropriate response factors and calibration; detector response need not be identical for every substance. An uncalibrated large peak is not automatically the same mass as any other equal-area peak.
- Coupling with mass spectrometry — GC–MS or LC–MS can combine separation with a mass spectrum of a component, helping distinguish coexisting substances in forensic or sport-testing examples. Retention and spectral comparison with appropriate references strengthen identification. The combined instrument still needs validated calibration, controls and interpretation rather than automatically proving a disputed real-world conclusion.
- Combined unknown workflow — First establish formula and major groups from mass, IR and chemical evidence, then assemble fragments and symmetry using carbon/proton NMR and test consistency with chromatography. Record justified alternatives, missing evidence and a discriminating next measurement. Distinguish qualitative identity, quantitative amount, sample purity and actual practical competence as separate conclusions.