Defining a coastal system — A coastal system links the land, beach, nearshore water and sediment stores through transfers of matter and energy. Its boundary is chosen for the question: a beach profile is smaller than a sediment cell. Explain what crosses that boundary before describing a system as open or approximately closed.
Inputs and outputs — Inputs can include river sediment, eroding cliffs, onshore transport and artificial nourishment; outputs include offshore loss, alongshore export and extraction. Wind and waves supply energy rather than being additional sand. The same transfer can be an output from one beach and an input to its neighbour.
Stores and transfers — A beach, dune, offshore bar and estuary can store sediment temporarily. Longshore transport, cross-shore exchange and wind-blown movement connect them. A store growing during a calm month need not be a permanent sink, because a later storm can remobilise the accumulated material.
Sediment cells — A sediment cell is a coast and nearshore area within which sources, transfers and stores form a connected sediment system. Resistant headlands and deep-water boundaries may restrict exchange, but cells are seldom perfectly sealed. Smaller sub-cells and seasonal reversals can matter for a local management decision.
Constructing a budget — For a specified period and boundary, change in sediment storage equals total inputs minus total outputs. Use consistent units, such as cubic metres per year for flows and cubic metres for storage change over a year. A large input does not mean accretion (a net build-up of sediment) if the outputs are larger.
Worked sediment balance — In a fictional year, cliff input is 12,000 m³, river input 4,000 m³ and nourishment 9,000 m³. Alongshore export is 18,000 m³ and offshore loss 11,000 m³. Inputs total 25,000 m³; outputs total 29,000 m³; storage change is −4,000 m³. This is a system deficit, not a prediction of uniform retreat at every point.Fictional flows cross one defined boundary during one year. The deficit describes the net change of its sediment stores, not a uniform retreat rate.
Gross and net transfers — If 70,000 m³ moves east and 50,000 m³ west in a year, the net eastward transfer is 20,000 m³ while gross movement totals 120,000 m³. A small net transfer can conceal considerable mobilisation. Do not use a net annual direction to claim that transport never reverses.
Dynamic equilibrium — A coast can adjust around a changing balance between energy, sediment supply and form. Its profile may fluctuate while its longer-term average changes little. Equilibrium does not mean no waves, no movement or a permanently fixed shoreline, and external forcing can shift the range of adjustment.
Feedback and thresholds — Storm erosion can move sand to a nearshore bar that dissipates later wave energy, a possible stabilising feedback. Conversely, removal of a protective beach can expose a cliff to further attack. A threshold is a condition beyond which the response changes, such as enough storm energy to mobilise previously stable material. Identify the sequence and timescale: labelling a feedback positive or negative describes its effect on change, not whether it benefits people.
Human changes to connectivity — A groyne can retain sediment locally while reducing supply farther along the transport pathway. A dam can intercept river sediment before it reaches the coast, while dredging can remove a store. Judge the whole relevant budget and timescale rather than treating a defended beach as an independent box.
Waves, tides and coastal energy
Wind-generated waves — Wind transfers energy to the sea surface. Wave development depends on wind speed, how long it blows and the unobstructed distance over water, or fetch. A long fetch alone does not guarantee large local breaking waves: duration, wind direction, offshore conditions and shelter also matter.
Wave characteristics — Wave height is the vertical distance from trough to crest; wavelength is the horizontal distance between successive crests; period is the time between crests passing a fixed point. Steepness is height divided by wavelength. A two-metre wave with wavelength forty metres has steepness 0.05, a dimensionless ratio.
Energy and water motion — Waves transmit energy while water particles largely oscillate in orbital paths offshore; they do not carry the entire ocean surface continuously forward at wave speed. Near the seabed and during breaking, friction and turbulence transform the motion and can mobilise sediment.
Approaching shallow water — As a wave enters shallow water, interaction with the bed slows it and reduces wavelength. Its period normally remains approximately unchanged along that path; height and steepness can increase before breaking. Do not say that all three of speed, wavelength and period must fall together.
Wave refraction — Parts of a wave crest entering shallow water slow first. Where seabed contours wrap around a headland, this can turn wave fronts and concentrate energy there while spreading it in a bay. Bathymetry (the shape and depth of the seabed), offshore wave direction and coastal geometry determine the actual pattern; bays are not always erosion-free.
Breaking and dissipation — A wave breaks when its steepness and local depth make its form unstable. Spilling breakers dissipate energy progressively, whereas plunging breakers can concentrate impact. Breaking, turbulence and bed friction dissipate energy, so offshore wave height alone is an incomplete measure of force reaching a cliff.
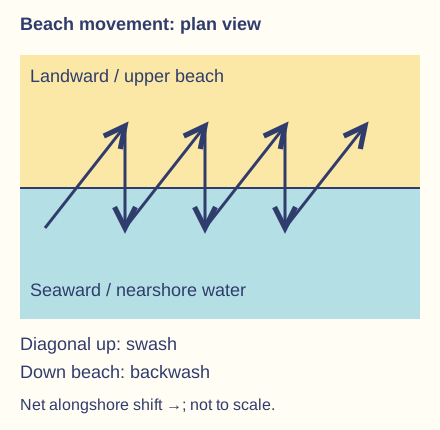
Swash and backwash — Swash is water moving up the beach after a wave breaks; backwash returns downslope under gravity. Infiltration into permeable beach material can reduce surface backwash. Direction and sediment transport depend on wave approach, slope, grain properties and interaction with succeeding waves.
Constructive-wave model — Relatively low-steepness waves with a strong uprush relative to surface backwash can move material landward and build a berm, a ridge of sediment near the upper part of the beach. The constructive label summarises a net beach response under stated conditions. It is not a guarantee that each individual wave deposits material everywhere or that all summer conditions are identical.
Destructive-wave model — Steeper storm waves and strong return flows can remove sediment from the upper beach and transfer it offshore, flattening the profile or building a bar. Some of this sediment can return under calmer conditions. Beach erosion during a storm need not mean that all material has left the wider coastal cell permanently.
Wave energy comparison — For otherwise comparable waves, energy per unit surface area is proportional to the square of height. Doubling height gives roughly four times this energy measure. Wave power also depends on the rate of energy transmission, so height-squared reasoning alone does not supply a complete local erosion prediction.
Tides and tidal range — Astronomical tides are periodic changes in water level driven mainly by the gravitational effects of the Moon and Sun within the rotating Earth system. Tidal range is the difference between a high and low tide. Local basin shape and depth affect timing and magnitude; a tide is not simply another wind wave.
Spring and neap tides — Near new and full Moon, the solar and lunar tidal effects align and spring-tide ranges are generally larger. Near the quarter moons they partly offset and neap ranges are generally smaller. Spring tides occur throughout the year; the word does not name the spring season or imply a storm.
Tidal currents — Flood currents generally carry incoming water landward and ebb currents carry outgoing water seaward through the relevant estuary or entrance; timing varies locally. These horizontal flows accompany tidal-level change, especially through narrow entrances. Currents can transport sediment even in a sheltered setting with small wind waves. Distinguish vertical tidal level change from the current velocity measured at a point.
Surge and total water level — A storm surge is a weather-driven departure from predicted astronomical tide, associated with wind and air pressure. High tide, surge and wave effects can combine to raise coastal flood risk. They are separate contributions, and coincidence of their peaks matters; a surge is not a tsunami.
Energy settings and exposure — An open coast facing prevailing storm waves often receives more wave energy than an enclosed bay, while a narrow tidal inlet can have strong currents despite limited fetch. Compare wind-wave exposure, tidal energy and sediment mobility separately. A sheltered coast still experiences change through tides, runoff and exceptional events.
Erosion, weathering and mass movement
Weathering and erosion — Weathering breaks down or alters rock in place, while erosion involves removal and transport. Salt crystallisation can weaken a cliff before waves remove fragments. The processes reinforce each other, but naming the agent removing material is different from explaining why the material became susceptible.
Hydraulic action and quarrying — Wave impact and fluctuating water pressure exploit cracks and joints; trapped air can also be compressed and released. Wave quarrying dislodges blocks along weaknesses. Effectiveness depends on joint geometry, available wave energy and water access, rather than every wave excavating an intact block of rock.
Abrasion and corrasion — Sediment carried or thrown by moving water scours rock surfaces, a process also called corrasion. A supply of tools and sufficient energy are required. A thicker beach can instead absorb wave energy and protect a cliff, so more sediment does not always mean more cliff erosion.
Cavitation — Rapid pressure changes in turbulent water can form and collapse vapour cavities, producing local stresses on rock. Keep this distinct from the compression of ordinary air in a crack and from abrasion by transported stones. It contributes within a wider erosional system rather than explaining every coastal landform alone.
Solution — Chemical dissolution removes soluble minerals, with effectiveness depending on rock composition and water chemistry. Carbonate rocks can be affected by weakly acidic water. Do not assume that every lithology dissolves equally or confuse solution of material with mechanical grinding by sediment.
Attrition — Transported particles collide and their edges chip or wear down, tending to become smaller and rounder. Attrition changes the sediment itself; abrasion describes its scouring effect on another surface. Grain shape also reflects source material and transport history, so rounded particles do not prove one unique journey.
Salt and frost weathering — Salt crystals growing in pores can exert stress, especially where repeated wetting and evaporation occur. Freeze-thaw weathering requires water entering cracks and suitable freezing conditions. A coastal location alone does not guarantee either process dominates; relate the mechanism to actual moisture, temperature and rock properties.
Chemical and biological weathering — Carbonation involves reaction with carbonic acid, hydrolysis involves reaction with water, and oxidation involves reaction with oxygen. These chemical processes alter susceptible minerals; roots can prise open weaknesses and organisms can alter rock surfaces. Temperature, water supply and exposure influence rates. Separate an observed weakened surface from an unsupported claim about which process caused it.
Rockfalls and slides — Rockfalls detach and fall from steep faces, often along joints. Translational slides move along a relatively planar surface such as a bedding plane; rotational slumps move along a curved failure surface and may leave backward-tilted blocks. Classify movement from its geometry rather than calling all cliff collapse a slump.
Water and slope failure — Rain can increase the weight of slope material and pore-water pressure, reducing effective friction along a potential failure surface. Marine undercutting can remove support at the toe. A collapse after rain may therefore reflect coupled sub-aerial and marine influences, not a single isolated cause.Rainfall effects and marine toe erosion can combine with geological weaknesses. The scheme identifies interacting mechanisms, not a necessary sequence at every cliff.
Runoff and cliff recession — Concentrated surface runoff can cut gullies and transport loosened cliff material toward the beach. Removal of fallen debris by waves exposes the cliff again, whereas persistent debris may temporarily protect its foot. Cliff recession can be episodic: several quiet years can precede one large failure.
Geological controls — Lithology means rock type and its physical characteristics. It influences resistance and permeability, while joints, faults, bedding dip and layer contrasts influence water access and failure. A resistant cap above weaker material can create overhangs; permeable rock above an impermeable layer can concentrate groundwater. Explain the arrangement instead of relying on the label hard or soft rock alone.
Transport, deposition and geographical evidence
Traction and saltation — Large grains can roll or slide along the bed as traction; smaller bed particles can hop in saltation. Which mode occurs depends on flow strength, turbulence and the particle's size, density and shape. One grain can switch mode as conditions change, so grain categories do not define permanent transport modes.
Suspension and dissolved load — Fine particles can be held within turbulent water as suspended load, while dissolved ions are carried in solution. Turbidity records suspended material rather than dissolved load alone. Suspension can persist beyond the surf zone; the transport pathway depends on currents and settling as well as waves.
Longshore drift on a beach — Obliquely approaching waves can drive swash diagonally up a beach while backwash returns more directly downslope. Repetition produces net alongshore displacement of beach sediment. Wave-driven longshore currents also transport material in the surf zone; do not reduce the whole nearshore system to a zigzag on dry sand.The zigzag represents a simplified beach-grain pathway on a straight shoreline. Wave-driven longshore currents provide an additional nearshore transport mechanism.
Changing transport direction — A change in wave approach can reverse alongshore transport, while headlands and local bathymetry can alter direction along one coastline. The prevailing wind helps explain dominant patterns but does not guarantee every day's movement. Distinguish an observed short-term direction from an annual net sediment budget.
Deposition and sediment sorting — Sediment settles or remains where transport capacity becomes insufficient for that material. Coarser particles commonly need greater energy to keep moving, while fine cohesive mud behaves differently from clean sand. A fall in energy can deposit material, but actual deposition also requires a sediment supply and suitable settling conditions.
Cross-shore exchange and wind — Storm waves and return flows can move upper-beach sand offshore; calmer waves can move some back landward. Dry exposed sand can be blown inland and trapped by dune vegetation, but wet grains are harder to entrain. A beach-dune-bar system therefore exchanges sediment in more than one direction.
Measuring a beach profile — At a safe authorised site, a transect perpendicular to the shoreline can record changes in slope and height using consistent distance and level measurements. Repeat at comparable tidal stages and locations. A single profile records a cross-section at one time, not the volume or sediment balance of an entire coast.
Assessing transport measurements — Tracers can indicate movement of selected particles, while repeated profiles, sediment samples and imagery show different aspects of change. A tracer's size or shape may not represent all sediment, and a brief observation can miss storm transport. Compare methods and record uncertainty rather than extrapolating one stone's motion directly to an annual flux.
Worked retreat rate — In fictional mapped data, a cliff edge retreats 24 m perpendicular to a fixed baseline over 30 years: mean retreat is 24 ÷ 30 = 0.8 m per year. If map alignment is uncertain by several metres, report the limit. The average is not proof of 0.8 m retreat in each year or a linear forecast.
Comparing evidence across scales — An aerial image measures shoreline position relative to its date, tide and definition of shoreline; a sediment sample measures grains at a selected site. Combine compatible evidence to test a process explanation. Correlation between a new structure and nearby erosion does not alone exclude storms, supply changes or earlier trends.
Risk and safe geographical practice — Breaking waves, incoming tides, unstable cliffs, soft mud and fast currents create serious coastal risks. Use existing verified data or staff-approved methods and access; do not approach a cliff face or enter water to create revision evidence. These illustrative methods do not describe a completed personal fieldwork project or an assessment submission.
Test yourself
50 questions · Random sets of 10. These quick checks support revision; practise longer explanations and justified judgements too.
 Mr Kidman's Classroom