Confirmed contrasting studies — The local study is Wickford, particularly Wickford North, and the contrasting distant study is Detroit. Both demographic/cultural change and economic change/social inequalities are taught. Use the emphasis required by the question while connecting relationships, lived experience, meaning and representation; do not treat the two lenses as entirely separate histories.
Place and spatial boundaries — Wickford town, its parish, a built-up area and Wickford North ward are different units; Detroit city differs from its metropolitan region and individual neighbourhoods. A boundary serves a statistical or political purpose and may not match lived identity. State unit, date and scale before comparing population, culture, income or change.
Endogenous and exogenous influences — Topography, built form, land use and local histories contribute to place character, while migration, investment, government, trade and media connect places to wider systems. The distinction depends partly on scale: a railway station is local infrastructure shaped by external networks. Explain interaction rather than placing every influence permanently into one box.
Insider, outsider and belonging — Experience, residence, work, age, culture and access shape how people know a place. An insider can still feel excluded, while someone living elsewhere can have strong family or cultural ties. Do not assume a single authentic resident viewpoint or that physical proximity guarantees the same lived experience for everyone.
Evidence across time — Use compatible census/household data, maps, photographs, economic records and published accounts for past/present comparison. A snapshot records characteristics but cannot establish a trend alone. Boundaries, question categories, economic conditions and population bases can change, so differences need testing before being labelled social transformation.
Wickford: connections, demographic and cultural change
Local setting — Wickford is in Essex within Basildon borough, with connections to London and other South Essex settlements. Low-lying parts of the town and the River Crouch contribute to its physical setting, while roads, rail, homes and local services shape everyday experience. Borough-wide statistics do not automatically describe Wickford North's residents.
Railway and historical development — Wickford Town Council's history links the arrival of the railway in 1889 with changes to farms, estates and speculative plotland development, where land was divided into small plots for sale, often before substantial infrastructure existed, followed by industry and housing growth. Transport connected land and residents to wider labour and property markets. Treat this account as a local institutional history, to compare with maps and other evidence rather than a complete voice for every past resident.
Commuting and connections — Rail and road access connect Wickford to jobs, study, shopping and services beyond the town, while people also work locally. Journey costs, timetable reliability, mobility and caring responsibilities affect who can use those connections. A direct line to London does not establish that every resident commutes there or has identical access to high incomes.
Ward dates and comparability — Nomis Census 2021 tables identify Wickford North as E05004035 on 2022 ward geography; Basildon's later electoral arrangements took effect in 2024. Use the boundary vintage printed with the dataset. A ward retaining the same name is not proof that its area or population base remained identical through a reorganisation.
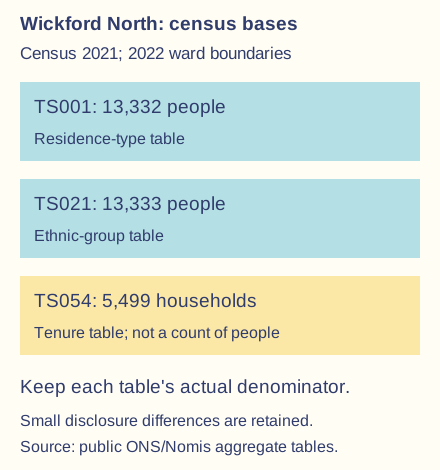
Verified ward population snapshot — Census 2021 table TS001 reports 13,332 usual residents for Wickford North on that 2022 ward geography: 13,211 in households and 121 in communal establishments. The figures count people, not 13,211 separate households. They describe the 2021 census population within the stated reporting boundary, not an estimate of today's ward population.
Cultural composition evidence — The corresponding TS021 ethnic-group table has a total of 13,333 and reports 12,420 residents in its broad White category, about 93.2% on that table's base. Ethnic categories are self-identifications within the survey's definitions; they do not reveal every person's nationality, language, beliefs, cultural practices or sense of belonging.
Small table differences — The one-person difference between the TS001 and TS021 totals should not be silently forced to match. Nomis explains statistical disclosure controls including small count perturbations, so tables can differ slightly. Use each table's proper denominator and do not present such a tiny discrepancy as evidence of migration between two simultaneous census measures.
Demographic change and services — Changing household formation, age structure, mobility and settlement growth can alter needs for housing, schools, shops, care and transport. Test those mechanisms with actual dated local data and maps. One 2021 ethnic or tenure snapshot does not prove that a particular group recently arrived or that a national trend occurred at the same rate locally.
Memory and physical events — The town council records the September 1958 River Crouch flood and a press image of a partly submerged bus at Halls Corner. Such an event can enter shared memory and external representation, but residents may remember or value it differently. A dramatic historical photograph does not establish present flood probability or the whole town's everyday conditions.
Local institutions and identity — Wickford gained a town council in 2022, adding a local institutional scale alongside borough/county structures. Councils, archives, groups, schools and businesses can shape representation and place-making. Institutional publicity is evidence of a particular attempt to express or influence identity, not proof that all residents share that narrative.
Wickford: economic change, housing and inequalities
Employment and property linkages — Accessible transport, local firms, retail and nearby labour markets create economic connections, while housing demand reflects incomes, supply, borrowing and location. Some residents gain from property value or new opportunities while others face affordability and travel barriers. Do not infer each person's class, wealth or occupation merely from a town or ward average.
Verified tenure evidence — Nomis TS054 reports 5,499 households in Wickford North on the 2022 ward geography in Census 2021: 4,239 owned, 528 socially rented, 700 privately rented, 31 shared ownership and 1 rent-free. These sum to the table's total, with the owned share about 77.1%. Household tenure is not a direct measure of each resident's income, debt or housing quality.ONS/Nomis public aggregate Census 2021 tables for E05004035 on 2022 ward geography. Different statistical bases and disclosure controls must remain visible; these are not counts for the later 2024 boundary.
Inequality within a local average — Owner-occupation can coexist with mortgage pressure, low income, inaccessible homes and considerable variation in assets; renters also have varied circumstances. Compare income, work, prices, condition and access using appropriate definitions before judging inequality. An area-average ownership share cannot justify a claim that all residents are affluent or that no housing need exists.
Transport investment and place-making — Greater Anglia's February 2025 announcement records a signed station-upgrade contract, while its September 2025 announcement records construction starting with an intended autumn 2026 completion. These dated sources show decisions and planned delivery, not by themselves confirmation of final completion or measured benefits. Evaluate accessibility, service use and wider effects separately from the announcement.
Regeneration and stakeholders — Improvements to transport, shops, public space or housing can change access, demand and perceptions. Residents, commuters, retailers, developers and people with mobility or affordability constraints may evaluate the same change differently. Compare the actual proposal, implementation and outcome; do not treat every new building or promotional image as proof of inclusive regeneration.
Testing local economic change — Compare matched historical maps, land uses, business/service records, prices/incomes on suitable bases and published consultation evidence. A change in a shop frontage does not measure every job lost or gained, and an announced project is not an observed increase in resident welfare. Explain alternative influences and identify which groups the evidence represents.
Detroit: population, culture and economic restructuring
Distant setting and connections — Detroit lies in Michigan beside the Detroit River and the Canadian city of Windsor, within a wider metropolitan and cross-border economic region. Transport, manufacturing, trade and migration connect it to national and global systems. Data for Detroit city must not be labelled as the entire metropolitan area or every automotive plant in the region.
Industrial growth and migration — Automotive manufacturing and related work helped attract people, capital and infrastructure, while migration included the Great Migration of African Americans alongside other movements. Employment opportunity and discrimination both shaped settlement and experience. Industrial identity grew through workers and communities as well as firms; avoid presenting one company or demographic group as the whole city.
Long-run census change — The US Census Bureau records Detroit city population of 1,849,568 in 1950 and 639,111 in 2020. These dated city counts demonstrate major long-run decline but do not show the exact annual trajectory or the whole region's change. Boundary, census method and intervening periods matter before assigning causes.
Recent estimates and dated narratives — The Bureau's 2025-vintage estimate gives 649,095 for 1 July 2025, with 1.5% growth relative to its revised 2020 estimate base of 639,534. That base differs from the published 2020 census count. A long-run decline narrative therefore does not justify claiming that every recent year continued the same trend, or mixing bases in a growth calculation.
Restructuring and suburbanisation — Automation, changes in industrial location, competition, suburban development, transport and housing policy affected employment and residence over time. Racial exclusion and unequal access shaped who could move, accumulate property or reach jobs. Explain overlapping mechanisms and different periods rather than making one riot, one firm or one ethnic group's decisions the sole cause of decades of change.
Housing, segregation and power — Discriminatory lending, housing practices and public decisions helped create unequal spatial opportunities and assets. Later disinvestment, vacancies and service pressures affected residents differently. Race is not a biological explanation of deprivation; examine institutions, access and historical power rather than treating an area's demographic category as its economic destiny.
Black Bottom and displacement — Detroit Historical Society documents Black Bottom as a predominantly Black neighbourhood demolished through mid-twentieth-century redevelopment, associated with Lafayette Park and freeway construction. The process changed housing, businesses and community connections, illustrating that official improvement narratives can coexist with displacement and loss. Keep locations, periods and community evidence explicit rather than treating the removed neighbourhood as an empty site.
Cultural continuity and representation — Music, work, faith, art, businesses and neighbourhood networks contribute to meanings beyond industrial output or dereliction. Cultural identity can persist and change despite population loss. A city's artistic reputation is not evidence that everyone has the same tastes or that cultural visibility automatically removes unequal access to jobs and housing.
Industry in visual representation — Diego Rivera's Detroit Industry murals, made in 1932–1933 and held at the Detroit Institute of Arts, provide an artistic representation of labour, technology and industry. Analyse selection, composition, patronage and historical purpose alongside economic data. The work is a constructed perspective, not a photograph recording every worker's conditions or a neutral measure of industrial productivity.
Oral history and contrasting experiences — Detroit Historical Society's Detroit 67 project collects written, audio and video histories about 1967 and the city's past/present. Such accounts reveal memory and varied lived experience, while selection, recall and the context of recording require evaluation. Do not invent a resident quotation, assume one account represents every group, or replace all other evidence with recollection.
Detroit: governance, regeneration and unequal outcomes
Municipal finance and services — A shrinking/changed tax base, service obligations, debt and governance decisions contributed to fiscal pressures alongside wider structural conditions. Detroit entered municipal bankruptcy in 2013 and exited under its adjustment in December 2014. The city's legal/financial event is not equivalent to every firm going bankrupt, all economic activity ending or recovery being complete on exit day.
Evaluating official recovery narratives — Michigan's December 2014 announcement presents restructuring as a positive turning point and describes service improvement and future ambitions. It is primary evidence of government actions and representation at that date, not an independent guarantee of all later outcomes. Compare budgets, service access and resident evidence rather than adopting the promotional conclusion without testing it.
Investment and spatial concentration — Reinvestment, reuse, businesses and public/private projects can improve some buildings and opportunities while benefits remain uneven among neighbourhoods. Test the actual places, dates and beneficiaries with compatible evidence. A downtown photograph or one successful project does not describe the condition of the whole city or prove universal inclusion.
Affordability and displacement risk — Rising demand can improve an area's market position while increasing rent or property pressures for some existing residents. Outcomes depend on tenure, wages, protections, vacancies, public policy and the scale of change. Regeneration means efforts to improve an area; gentrification involves change towards more affluent residents and investment, potentially increasing pressure on existing residents. The terms overlap but describe different processes; diagnose mechanisms and evidence rather than treating any renovation as proof of displacement.
Community agency and alternatives — Residents, community groups and local enterprises can shape land use, memory, services and development priorities. Decisions involve resources, ownership and political voice, not simply an outside investor rescuing an inert city. Compare local aims and actual capacity with external representations, without assuming every community group agrees.
Environmental and social legacies — Vacant or former industrial land can offer reuse and green-space opportunities while contamination, infrastructure and access constrain action. Demolition may remove hazards but can also remove heritage or change housing supply. Evaluate physical conditions, public resources and resident priorities rather than assuming every vacant plot is safe for immediate use.
Paired-place interpretation and geographical evidence
Comparing demographic and cultural change — Use settlement/industrial histories, migration, household composition, cultural evidence and lived experience to explain changing identities in both places. Wickford's London/South Essex connections and Detroit's industrial/metropolitan histories operate at different scales. Do not equate census ethnicity with complete culture or read current categories unchanged into the past.
Comparing economic change and inequalities — Connect labour markets, transport, housing, investment and governance with uneven opportunity and representation. Distinguish national or regional change from neighbourhood experience and a household's resources. A larger Detroit city population or higher Wickford ownership share does not, by itself, rank belonging, well-being or every resident's affluence.
Representations and selective images — Maps, statistics, heritage histories, publicity, art, oral accounts and photographs make different aspects visible. A close-up of dereliction can omit occupied streets; a celebratory investment image can omit rent pressure. Analyse author, audience, purpose, date, scale, selection and omissions, with evidence rather than automatically calling every representation false.
Quantitative comparability — The UK and US use different census dates, categories, estimation methods and reporting periods. US racial categories and UK ethnic-group categories should not be treated as identical definitions. Household, person, city and ward denominators also differ; choose a question the evidence can actually answer instead of directly ranking unlike percentages.
Worked practice comparison — In fictional matched areas, an owned-household share rises from 60% to 66%: a 6 percentage-point increase and 10% relative increase. Neither calculation alone establishes richer individuals or proves that no displacement occurred. Use the same boundary and household definition, then compare income, tenure transitions and experience before reaching a conclusion.
Geographical explanation and judgement — Choose the specified thematic emphasis, identify place and timescale, then connect endogenous/exogenous processes, meanings and lived experience with compatible evidence. Compare alternatives and unequal effects and state uncertainty. The strongest argument explains continuity as well as change, avoiding an idyllic commuter-town versus ruined-city caricature.
Worked long-run population comparison — Using the cited Detroit city census counts, 1,849,568 − 639,111 = 1,210,457 fewer residents between 1950 and 2020. Relative to 1950, the decline is about 65.4%. This calculation describes those endpoints; it does not prove uniform annual decline, the sole cause, the whole metropolitan trajectory or continued decline after 2020.
Distinguishing restructuring mechanisms — Deindustrialisation can describe falling manufacturing employment or its share, which need not match output because productivity and production methods can change. Suburbanisation redistributes people or activity from a central city toward surrounding suburban places and need not reduce the whole region's population. Specify which measure and boundary a restructuring argument uses.
Test yourself
50 questions · Random sets of 10. These quick checks support revision; practise longer explanations and justified judgements too.
 Mr Kidman's Classroom