Mr Kidman's Classroom


Revise the key ideas
Time series and rates
- Time-series display — Record the same measure at successive times and put time on the horizontal axis. Check equal time spacing and consistent definitions. A trend is the underlying longer-term direction; individual increases or decreases can reflect short-term random variation or seasonality.
- Seasonal and cyclic — Seasonal variation repeats on a fixed calendar cycle, such as higher summer sales each year. Cyclic variation repeats over longer or less fixed intervals, such as business cycles. Irregular variation includes unusual events; a single spike does not establish a seasonal pattern.
- Four-point moving average — Average four successive values, then move one observation forward and repeat. For 10,14,18,22,30 the averages are 16 and 21. Plot each halfway between its middle two time points; use a common period length so regular seasonal changes are smoothed.
Moving averages smooth a time series. Original illustrative diagram; numerical datasets are fictional worked examples. Enlarge diagram - Trend interpretation — A rising smoothed line suggests an increasing underlying measure; its gradient is change per time unit. Smoothing loses endpoint information and can hide abrupt changes. Draw a trend line consistently and state whether a prediction assumes that the trend persists.
Smoothing means averaging nearby values to reduce short-term ups and downs.
- Simple index — Set the base period to 100. Index = current value / base value ×100. If a price rises from £40 to £50 its index is 125, meaning 25% above the base, not £125. Compare indices only after checking their bases and definitions.
- Change between indices — Percentage change from index 120 to 132 is (132−120)/120 ×100 = 10%, not 12%. The 12 is an index-point change. Distinguish percentage change from percentage-point change in proportions, and use the earlier value as the denominator.
A proportion rising from 20% to 25% rises by 5 percentage points. Its percentage increase is 5 ÷ 20 × 100% = 25%.
- RPI, CPI and GDP — The Retail Prices Index (RPI) and Consumer Prices Index (CPI) track prices through defined baskets (selections of goods and services) and methods; their values need not be identical. Gross Domestic Product (GDP) describes the value of an economy’s output, and index series can express change relative to a base. Check whether values are nominal or adjusted for price changes before comparing purchasing power or growth.
Nominal values use prices at the time, before adjustment for price changes. Purchasing power means how much a sum of money can buy.
- Rates per population — A context formula such as births / population ×1000 standardises for different population sizes. With 240 births in 20,000 people the crude (unadjusted) birth rate is 12 per thousand. A higher count need not mean a higher rate; use comparable time periods and definitions.
- Forecasts from rates — If an annual rate of 8 per thousand applies to 50,000 people, expected count is 50,000 ÷ 1000 × 8 = 400. Such a prediction assumes the rate and population basis are suitable. Demographic differences (population characteristics such as age) can make a crude-rate comparison misleading even when arithmetic is correct.
Higher — seasonal estimates and indices
- Other periods and centring — Choose a moving-average length to match the seasonal period. Odd lengths have a central observation; even lengths fall between observations and can be centred by averaging adjacent moving averages. A quarterly four-point average removes a typical annual seasonal cycle; a monthly three-point average does not.
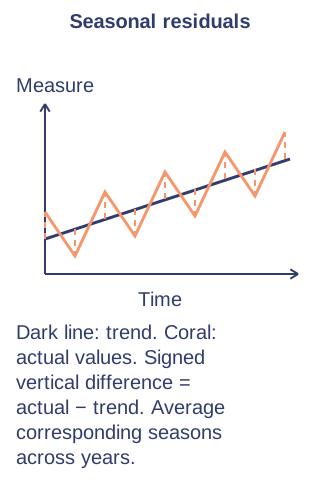
- Mean seasonal effect — In an additive model calculate actual minus trend for matching times, then average these deviations for each season across years. Effects should balance around zero for a complete cycle; rounding or imperfect trends can require adjustment. Seasonal variation is a difference in the measure's units.
Additive means modelling the observed value as trend plus a seasonal effect, with other variation left over.
- Seasonal prediction — Add a season's mean effect to the projected trend. If trend predicts 120 sales and the winter effect is −18, forecast 102. Explain that the forecast assumes stable trend and seasonal behaviour; unusual events or extrapolation can make it inaccurate.
- Weighted index — Multiply each component index by its weight, add the products and divide by total weight. Indices 110 and 130 with weights 3 and 1 give 115. Weights reflect expenditure (spending) or importance; an unweighted mean changes the meaning of the basket.
- Chain-based index — Each link compares a period with the preceding period. Multiply link factors to obtain overall change: links 110 then 120 give factor 1.1×1.2=1.32 and overall index 132 from the original base. Do not add the percentage increases.
- Standardisation — Follow any supplied rate-standardisation formula and identify its output and denominator. Applying group-specific rates to a common standard population (the same chosen population structure for each group) can make comparisons fairer when age profiles (the proportions in each age group) differ. Do not confuse a predicted count from a rate with a rate per thousand; report the formula's stated units.
Higher — seasonal estimates and indices
- Seasonal working — In an additive model, suppose spring observations in two years are 110 and 124 and their trend estimates are 100 and 112. Their deviations are +10 and +12, so spring's estimated mean effect is +11 units. If the four mean seasonal effects are +11, +19, −9 and −17, their sum is +4; subtract 1 from each (4 ÷ 4 = 1) to make a complete cycle balance around zero. Adjusted spring effect is +10. A projected spring trend of 140 therefore predicts 150, assuming the same seasonal pattern continues.