Mr Kidman's Classroom


Revise the key ideas
Research methods
- Primary and secondary — Primary research collects new information for the current purpose. Secondary research uses information already collected, such as visitor statistics or an earlier company survey. Online does not automatically mean secondary: a business's new web survey is primary. Choose methods to answer a question rather than collecting data without a purpose.
- Questionnaires — Closed questions such as a rating scale produce countable answers; open questions reveal reasons in respondents' words. Face-to-face, phone, postal and online surveys reach different people and have different costs. Short neutral questions and a clear response period help. A long or leading survey can reduce response quality.
- Interviews and focus groups — Interviews let researchers probe individual views; focus groups allow discussion among participants. They can explain why a visitor avoids a service, but take time and skill to run. Dominant participants and pressure to agree may distort group findings. A small discussion should not be presented as a representative percentage of all customers.
- Observation and visits — Structured observation might count queue lengths or record which information point visitors use. Visits can compare competitor facilities. Observation reveals what people do but may not explain their reasons. Use consistent categories, comparable times and suitable privacy arrangements; one quiet afternoon does not establish a whole season's demand.
- Secondary sources — Government statistics, market reports, trade journals, books, websites and company records can identify wider patterns. They can be quicker to access than new surveys. Check publication date, geographical coverage, definitions, original sample and commercial purpose. An old national report may be a poor guide to today's local customers.
- Qualitative and quantitative — Quantitative data includes counts, percentages and spending amounts. Qualitative data includes descriptions, views and reasons. A survey can collect both. Knowing that 40% dislike a transfer identifies scale; comments may reveal that late departures cause the problem. Neither type alone necessarily supplies the full answer.
Choosing and using evidence
- Sampling — A sample is a selected part of the population of interest. Surveying only social-media followers can exclude visitors who do not use that channel. Spread collection across relevant groups and times and record the sample size. A large biased sample can still mislead; a response count is not a quality guarantee.
- Question quality — Replace 'How excellent was our fast and friendly service?' with separate neutral questions about waiting time and staff support. Include relevant response options and avoid forcing a positive answer. Pilot the survey to reveal confusing wording. A pilot improves the instrument but does not prove the final results are representative.
A pilot is a small trial before the main research. Here, the research instrument is the questionnaire: test whether people understand the questions and can use the answer choices.
- Calculating findings — In a fictional survey, 36 of 60 respondents request an earlier breakfast. The proportion is 36 ÷ 60 × 100 = 60%. This describes respondents, not automatically all guests. Report the base and method so a reader can judge how much weight the evidence deserves.
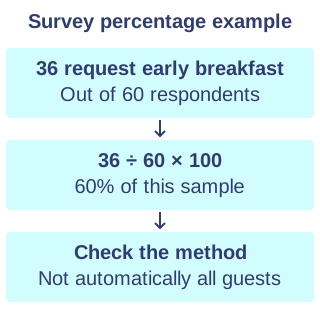
Illustrative worked values; not a live quotation. - Research decisions — A hotel considering breakfast changes could use booking records for guest patterns, a short survey for preferences and a small trial for actual uptake. A national industry report provides context but cannot decide the local menu alone. Explain why each chosen method supplies information needed for this decision and name its limitation.